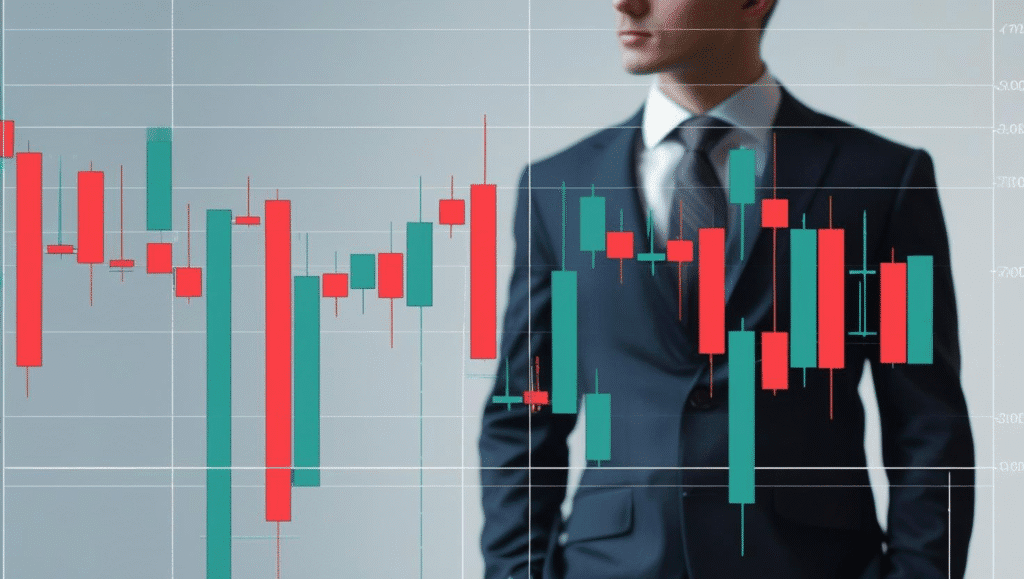
1. Why Technical Indicators Matter
In the pressure-filled world of day trading, every second, minute, and decision matters for a successful trade. Unlike the long-term traders, day traders rely on the minute-to-minute price movements.
This is the point where we need the technical indicators.
Technical indicators help users identify the volume, momentum, and provide the visuals that help them to make their trades successful.
There are hundreds of indicators in the market, but it is difficult to choose the best one for our trade. In this complete guide, I have covered some best and most commonly used technical indicators by day traders.
There are 7 top-most used technical indicators that help you make trades successfully.
2. What Are Technical Indicators?
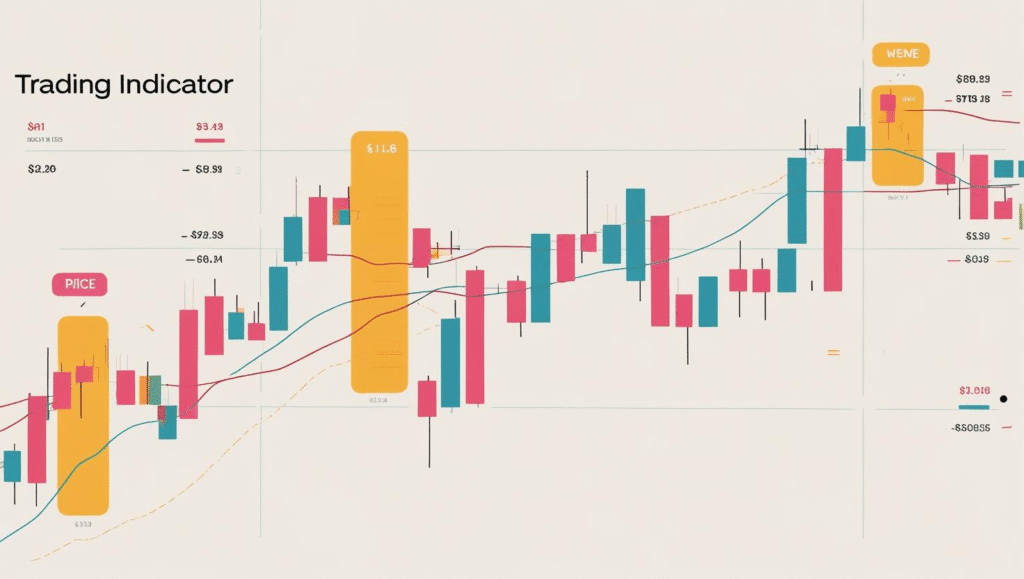
Technical indicators are mathematical calculations; these calculations are based on price, volume. Technical indicators help traders in identifying the market and making decisions based on these calculations. If you are thinking that these will be mathematical calculations, so it’s wrong. Calculations would be visible in the form of charts and graphs. Technical indicators are the visible patterns on your dashboard. So don’t get confused about how you would perform the mathematical calculations.
Technical indicators fall into these categories.
- Trend following indicators
- Momentum indicators
- Volatility indicators
- Volume indicators
After analysing these technical indicators, traders make their trades successful.
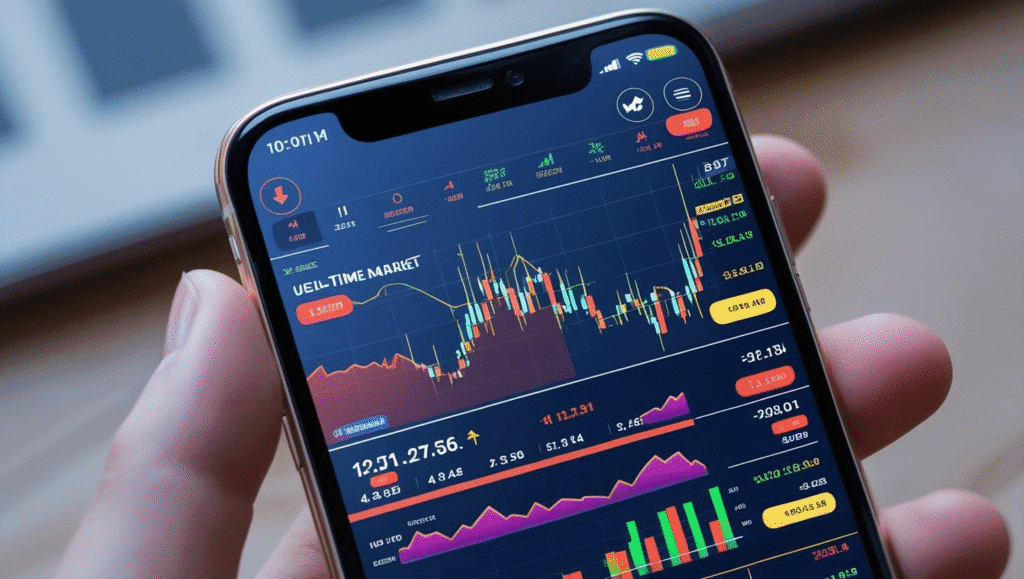
3. How Indicators Help Day Traders
In day trading, you often don’t have time to think for long. Technical Indicators help by:
-
Speeding up analysis
-
Filtering false signals
-
Providing confirmations
-
Highlighting opportunities
-
Minimizing emotional decisions
However, they’re tools—not guarantees. Successful traders use technical indicators as part of a complete strategy that includes price action, market context, and risk management.
4. The Top 7 Indicators Every Trader Should Know
What is the importance of this technical indicator?
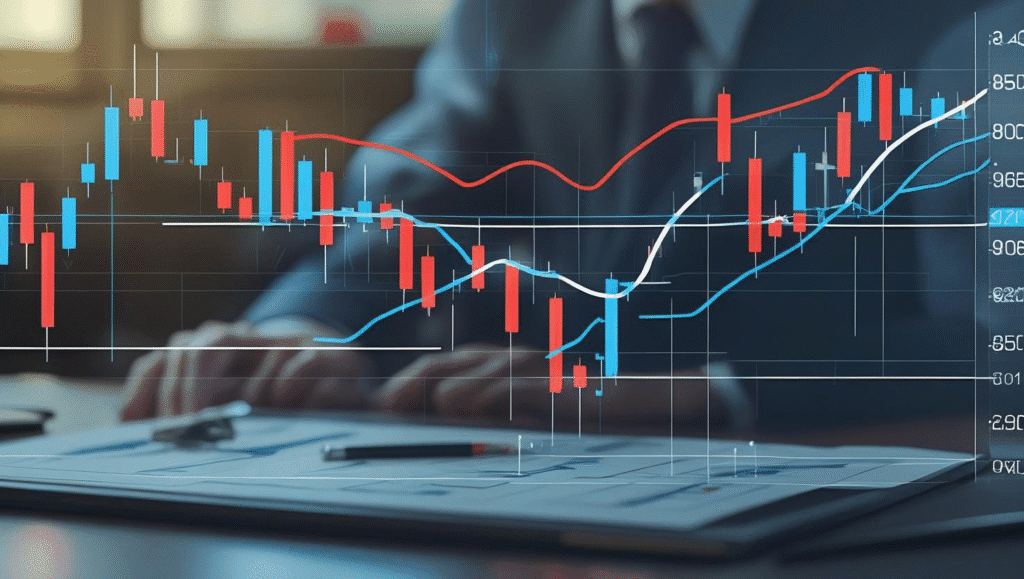
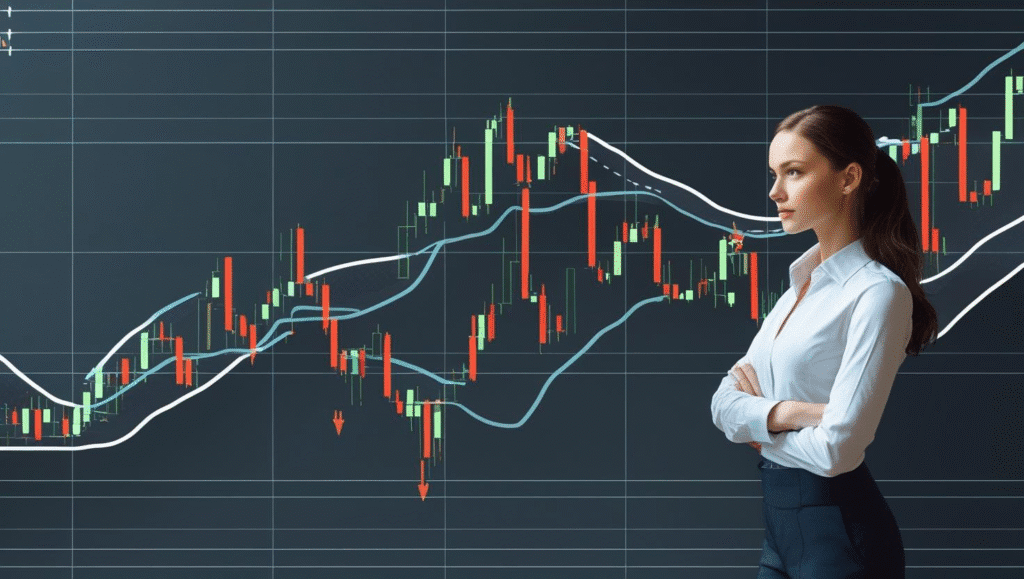
A Moving Average technical indicator smoothes the price to understand the trend.
- Simple Moving Average technical indicator (SMA): A basic average over a set number of periods.
- Exponential Moving Average technical indicator (EMA): Weights recent prices more heavily.
Why do traders love this technical indicator?
It helps confirm trends and provides dynamic support/resistance zones.
Best uses:
- Use 9 EMA & 21 EMA crossover for entry/exit.
- 200 EMA is often used to gauge the overall trend.
Quick tip:
Use EMAs for short-term trading and SMAs for longer trends.
What is the importance of this technical indicator?
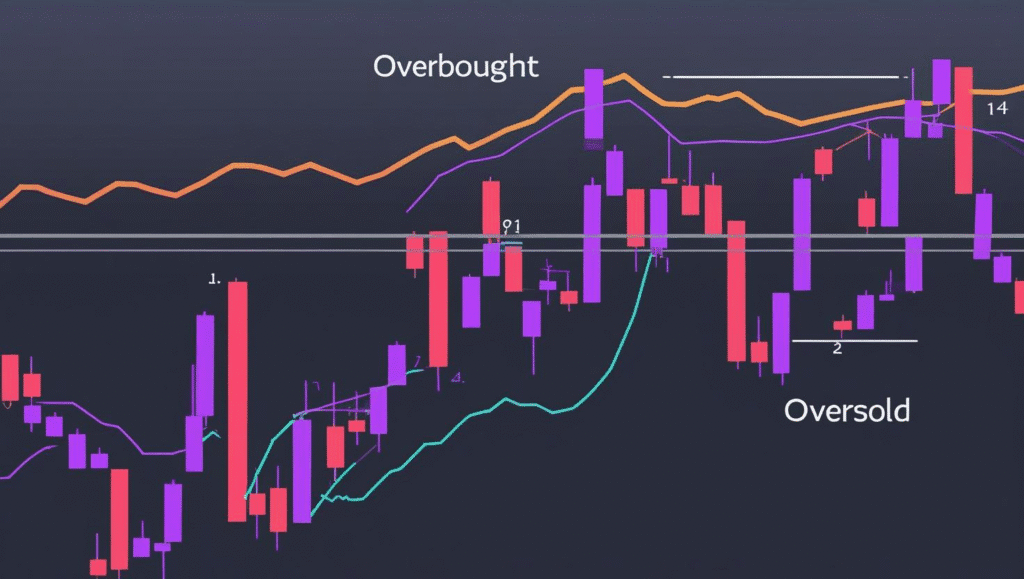
The RSI (Relative Strength Index) is a popular momentum indicator used in technical analysis to analyse the speed and volume of recent price changes. This technical indicator helps traders identify oversupply and overvaluation in a market. The RSI technical indicator is a bar chart that fluctuates between 0 and 100. J. Welles Wilder developed it and is commonly used to assess whether a stock or asset is:
- Overbought (possibly overvalued and due for a pullback)
- Oversold (possibly undervalued and due for a bounce)
Range:
0 to 100
- Above 70: Overbought
- Below 30: Oversold
Best uses:
- Catch reversal points
- Confirm trend strength
- Divergence trading
Pro tip:
Combine RSI with trendlines or price action for more accurate signals.
3. Bollinger Bands
are a trendy technical indicator used by traders to measure price fluctuation and identify possible trend reversals. These technical indicators show three lines on your chart.
- Middle line: A simple moving average (usually 20-period)
- Upper line: Middle band + 2 standard deviations
- Lower line: Middle band – 2 standard deviations
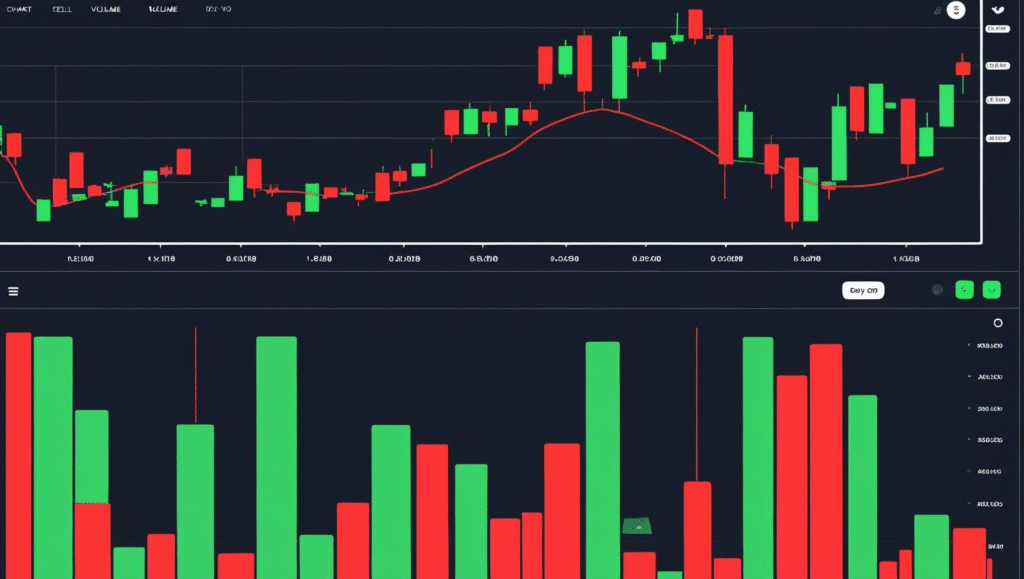
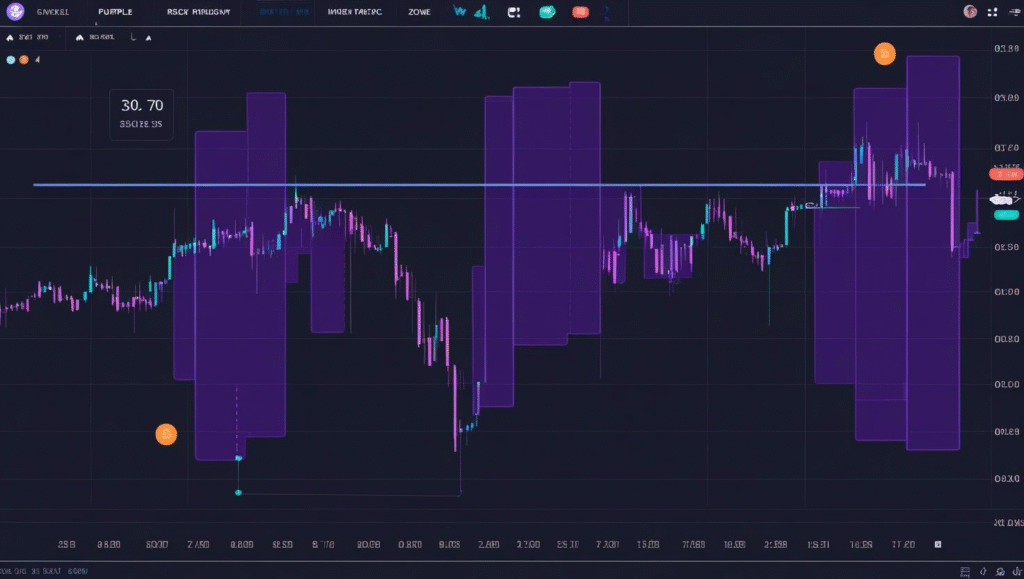
4: Volume: The Market’s Strength Meter
What is Volume in Trading?
Volume refers to the number of shares, contracts, or lots traded in a market during a given period. It’s one of the most powerful yet often overlooked indicators. Volume helps traders understand the strength behind price movements.
Think of volume as the fuel behind price – the more volume, the stronger the move.
Why Volume Matters
- If price is moving up, trading activity is heavy, and the trend is strong.
- If price is moving up but volume is low, the trend may be weak or false.
- Sudden spikes in volume often occur before reversals or breakouts
Volume as an Oscillator
While volume itself is not an oscillator, it’s often used alongside volume-based oscillators, such as:
- On-Balance Volume (OBV): Tracks cumulative volume to detect momentum.
- Chaikin Money Flow (CMF): Combines volume and price to show buying/selling pressure.
- Confirming breakouts (price + high volume = strong breakout)
- Spotting divergences (price making highs, volume dropping = warning)
- Validating chart patterns (e.g., head and shoulders, triangles)
-
Identifying accumulation or distribution phases
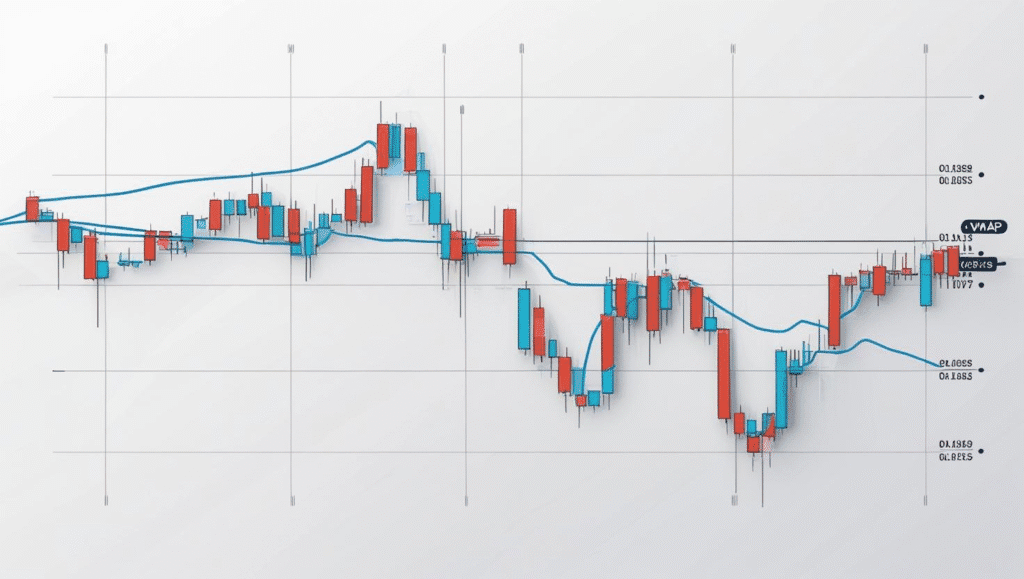
VWAP is a powerful trading indicator that tells you the average price a security has been bought or sold at during the day, factoring in both the price levels and how actively it’s been traded.
In simple terms, VWAP tells you the true average price, weighted by how much volume was traded at each price level.
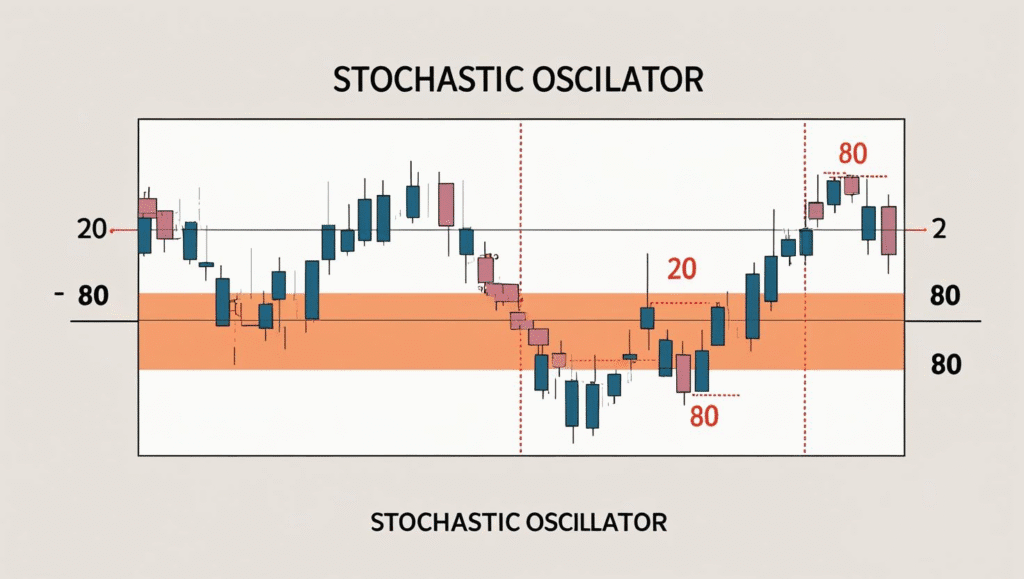
The Stochastic Oscillator is a handy tool traders use to spot when a stock might be too high (overbought) or too low (oversold), helping them time their entries and exits better. In simple terms, it tells you how strong or weak the current price is compared to its recent price range.
Think of it like this: if a stock is near its highest price over the last 14 days, the indicator will be close to 100
MACD is a momentum and trend-following indicator that helps traders spot shifts in direction, momentum, and potential buy or sell signals. It shows the relationship between two moving averages of a price.
Think of MACD like a radar—it helps you see when a trend is speeding up, slowing down, or possibly reversing.
indicator will be close to 100
Final Thoughts: Make Indicators Work for You
At the end of the day, technical indicators are just tools; they don’t predict the future, but they help you understand what’s happening right now. Whether it’s MACD, RSI, VWAP, or Bollinger Bands, the goal is the same: to give you an edge in the market.
But here is the key rule to follow don’t rely on each indicator blindly just practice them on your demo account and see what’s the difference in making the trade without using indicators and with using indicator.
Good Luck for your journey.


Pingback: Support And Resistance: 5 Powerful Strategies Every Beginner Must Know