1. Introduction
While trading in a trending market, whether it’s an uptrend or a downtrend, every trader reaches a point where they think the market is making moves, but what is the actual and right time to make the entry and get the profits from a live trade? This is the point where the concept of support and resistance comes into play, and we need it.
In the next part of the blog, I promise you that you will get to know each and every concept about the support and resistance levels and how to draw them accurately. I just need your full focus and attention while reading this post. And make sure that you keep your notes with you and draw the zones manually, then you will be able to draw them on your laptop screen.
Let’s start our journey towards the support and resistance levels.
In 2025, with more retail traders entering the markets and algorithms evolving rapidly, understanding how to identify accurate support and resistance zones gives you a significant edge. This guide will teach you exactly that, in a simple, beginner-friendly format.

What is an Impulsive Move and Retracement Move?
Before moving towards the support and resistance, first, there is a need to understand two basic moves of the market.
- Impulsive Move
- Retracement Move
When the market is in an uptrend or downtrend, basically the market shows these two types of moves.
Let’s take an example where the market is moving in an uptrend, and we want to make the entry, but we don’t know what the right time to enter the market is.
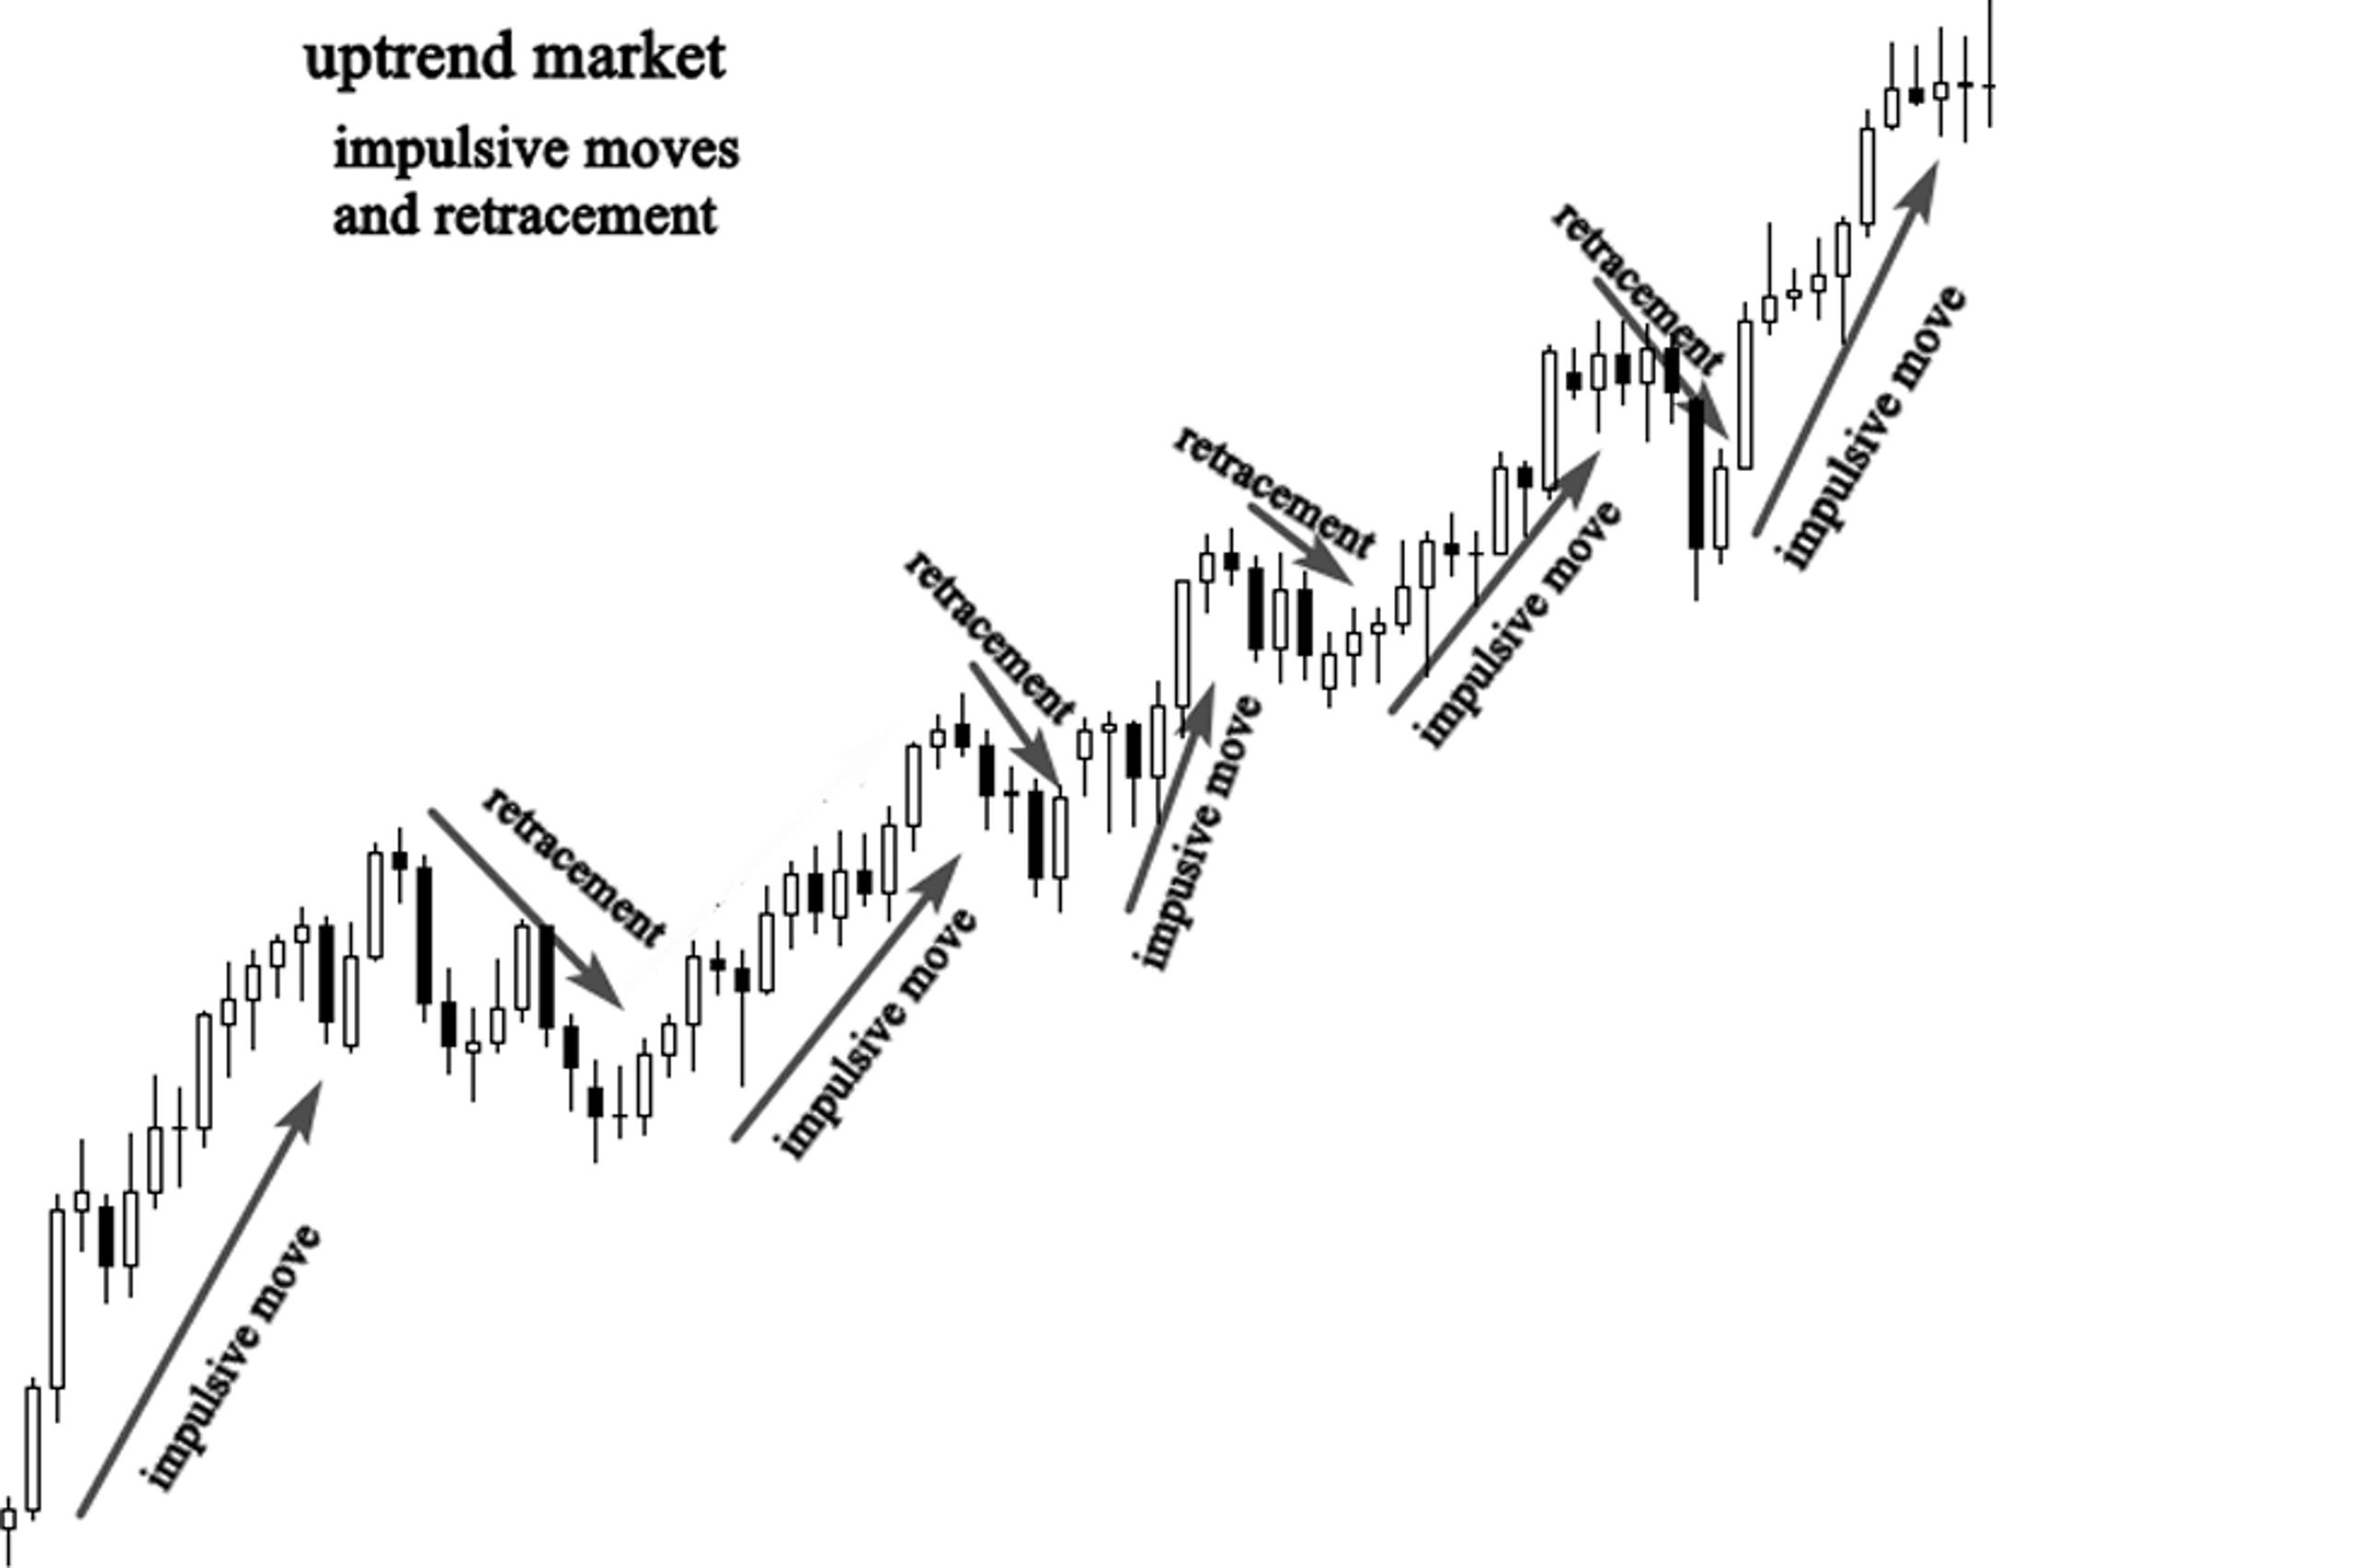
When the market is in an impulsive move, it moves in the direction of the trend. In our case, the market will move towards an uptrend.
After some time market starts moving in the retracement zone.
Here comes the question of how we will know about these moves and what would be the best time for our entry in the market to make profits. To solve this problem, we study the support and resistance zones, and these zones will help us to make our entry at the right time and to get the profits from the market.
See the diagram below, you will have a better understanding of the impulsive move and the retracement moves.
what is the best time to enter the market?
The best time for the entry of the professional trader is the beginning of the impulsive move of the market. If you are a buyer or seller, you should take the entry at the beginning of the impulsive move. Those traders who make the entry at the retracement move of the market are trapped. They end up with a loss.
So, how can we determine the beginning point of the impulsive move, where we can take the entry, and what is the beginning point of the retracement move, where we can avoid the entry? This concept is explained better by the support and resistance zones.
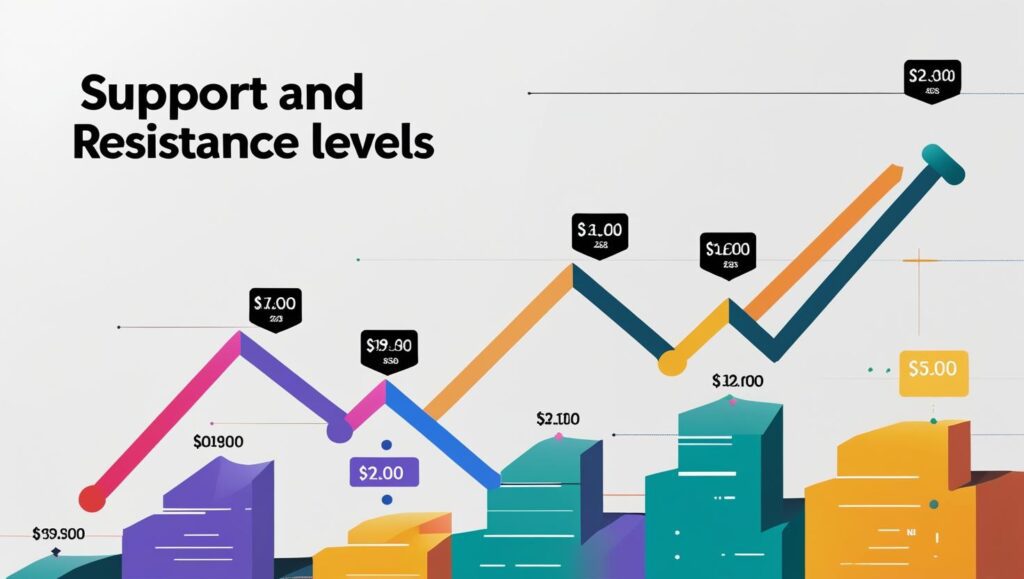
What is support and resistance?
- Support is a price area where buyers consistently step in, stopping the market from falling lower.
- Resistance is where sellers enter the market, preventing prices from rising further.
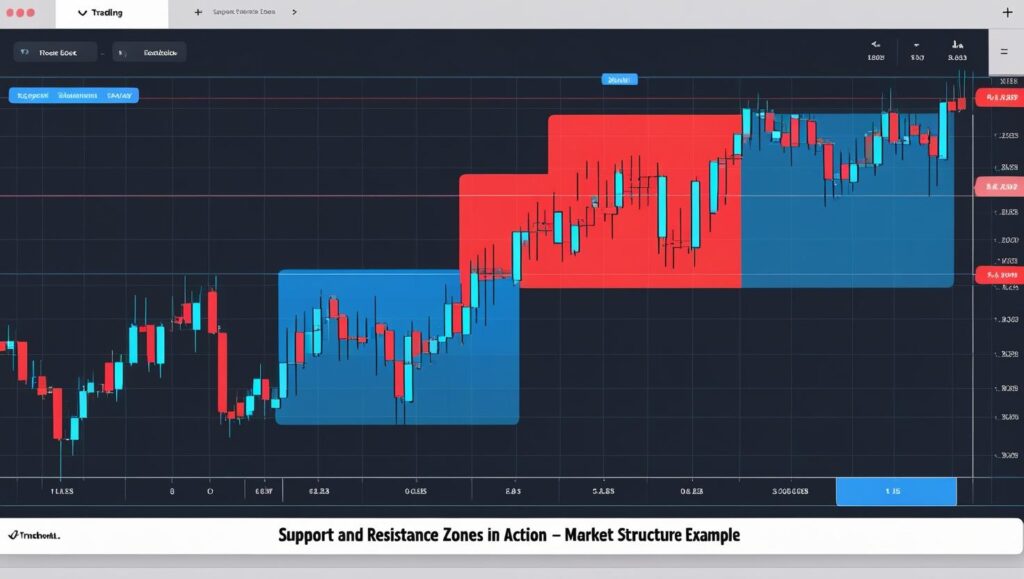
Rather than looking for one precise line, think of these areas as zones — flexible regions where price reacts, consolidates, or reverses.
How to Identify Accurate Support and Resistance Zones
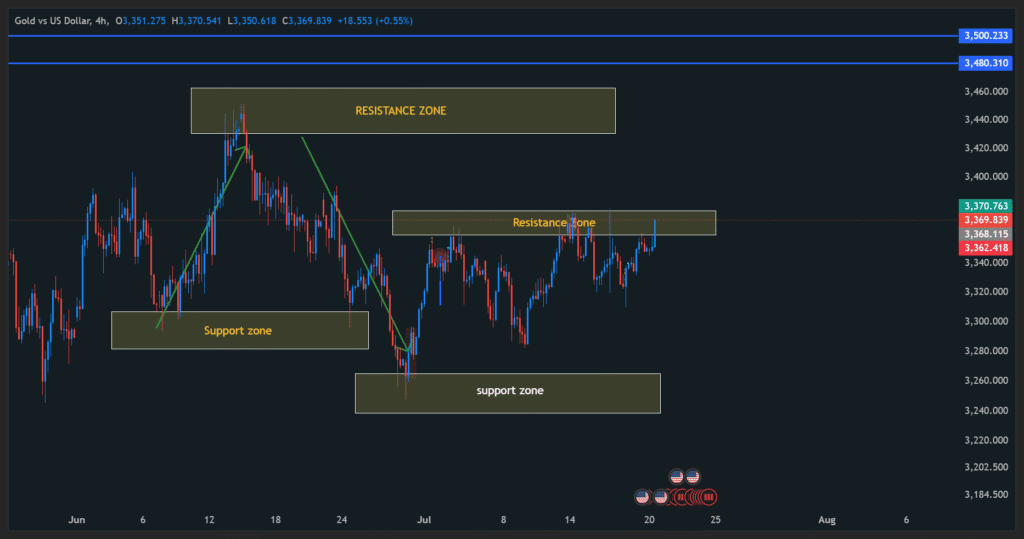
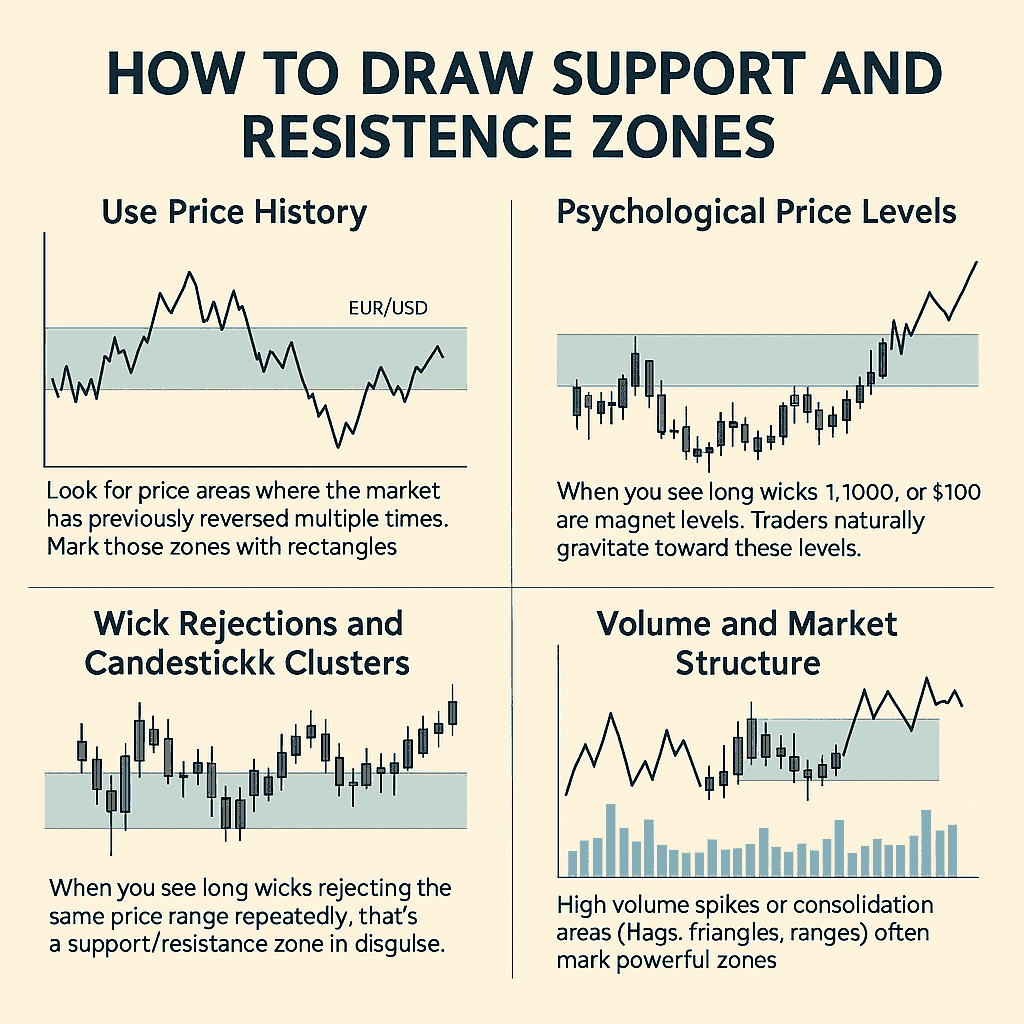
1. Use Price History
Look for price areas where the market has previously reversed multiple times. Mark those zones with rectangles instead of lines.
Example: If price reversed near 1.0850 on EUR/USD three times in the past, it’s a strong zone.
2. Psychological Price Levels
Round numbers like 1.1000, 15000, or $100 are magnet levels. Traders naturally gravitate toward these levels.
3. Wick Rejections and Candlestick Clusters
When you see long wicks rejecting the same price range repeatedly, that’s a support/resistance zone in disguise.
4. Volume and Market Structure
High volume spikes or consolidation areas (flags, triangles, ranges) often mark powerful zones.
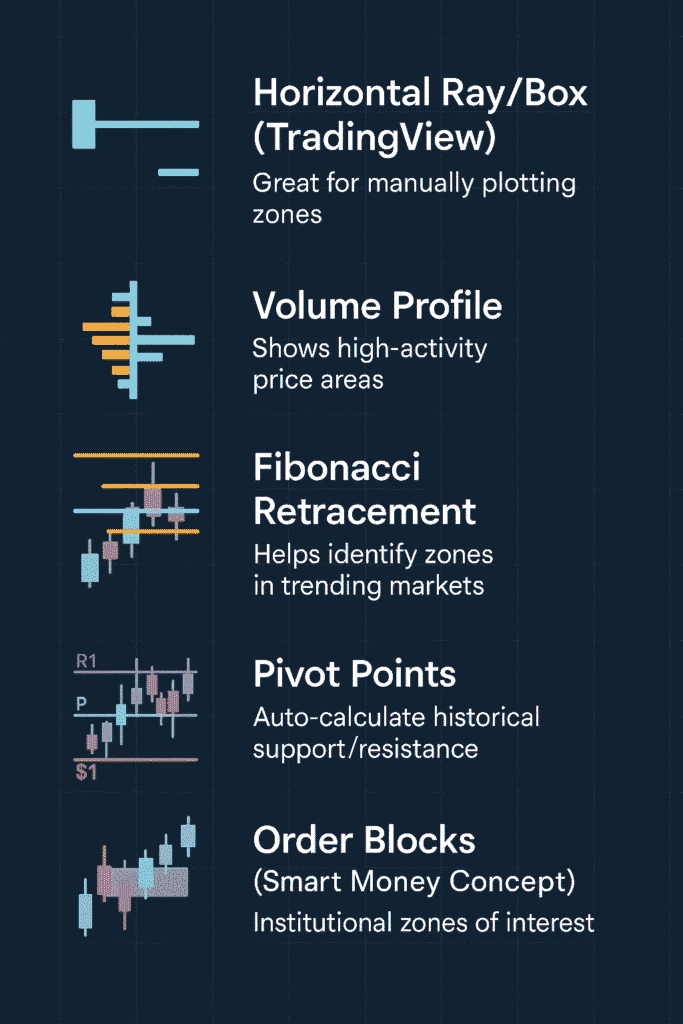
Top Tools and Indicators to Help You
- Horizontal Ray/Box (TradingView): Great for manually plotting zones
- Volume Profile: Shows high-activity price areas
- Fibonacci Retracement: Helps identify zones in trending markets
- Pivot Points: Auto-calculate historical support/resistance
- Order Blocks (Smart Money Concept): Institutional zones of interest
How to Trade with Support and Resistance
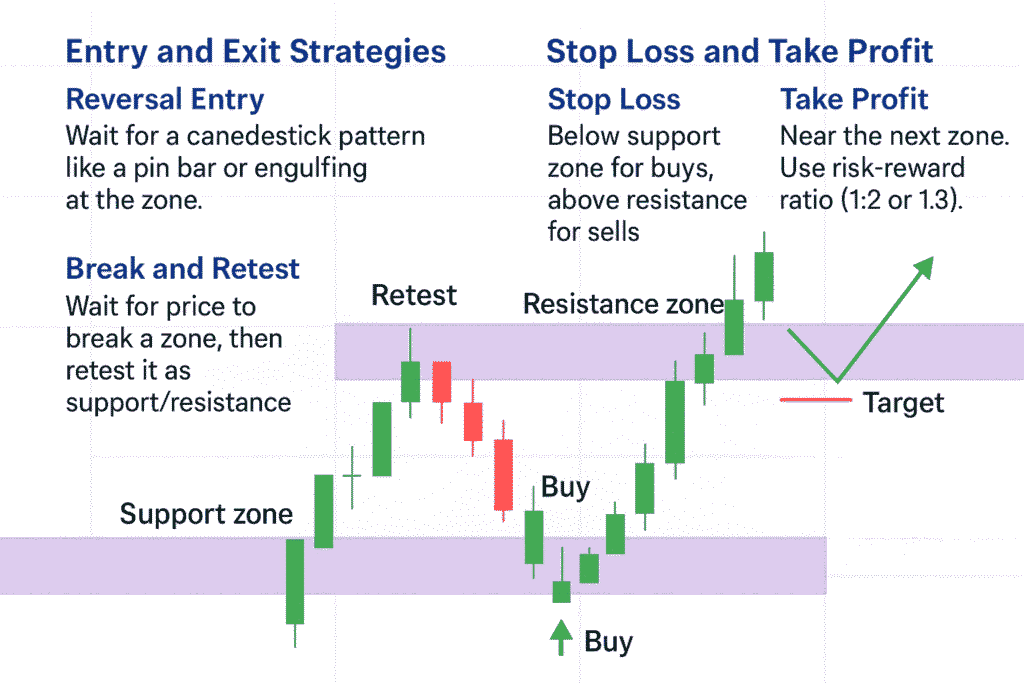
Entry and Exit Strategies
- Reversal Entry: Wait for a candlestick pattern like a pin bar or engulfing at the zone.
- Break and Retest: Wait for price to break a zone, then retest it as support/resistance.
Stop Loss and Take Profit Placement
- Stop Loss: Below support zone for buys, above resistance for sells.
- Take Profit: Near the next zone. Use risk-reward ratio (1:2 or 1:3).
Support and Resistance in Different Markets
Forex
Currency pairs respect historical zones well. Use daily and 4H charts for better accuracy.
Crypto
Highly volatile. Zones tend to be wider. Round numbers ($30,000 BTC) are key.
Stocks
Earnings, news, and gaps affect zones. Combine with volume analysis for better decisions.
Final Thoughts
Support and resistance zones are timeless. In 2025, while AI and automation dominate, human-level pattern recognition and intuition remain crucial.
By mastering how to identify and trade these zones, you align with market structure rather than fighting it. Whether you’re a beginner or seasoned trader, these principles are your foundation for consistent results.
Tip: Practice drawing zones daily on TradingView. Review past setups and learn from reactions. In trading, mastery comes from repetition.

Pingback: 5 Proven Smart Trading Strategies For Consistent Profits In 2025
Pingback: 15 Forex Trading Secrets Only Pros Know (Revealed)