Introduction
If you’ve ever jumped into a trade too soon or hesitated until it was too late, you already know how painful poor timing can be. Sometimes the price moves just a bit further before reversing, leaving you stuck with a loss or watching profits slip away.
That’s where the Relative Strength Index (RSI) can be a game changer.
For those just starting, the relative strength index is one of the simplest yet most effective indicators for spotting when a market is overbought or oversold. It can also help confirm momentum and highlight possible reversal points before they unfold.
In this beginner-friendly guide, you’ll discover:
- What RSI is and why traders rely on it
- How it works (without drowning you in complex math)
- How to read relative strength index confidently
- Easy strategies for new traders
- Common pitfalls and how to avoid them
- Real-world trade examples
- Pro tips to maximize RSI’s effectiveness

Understanding RSI – The Foundation
The Relative Strength Index (RSI) is an indicator used to show how quickly a price changes over time. It was developed by J. Welles Wilder Jr. in 1978. Its purpose is simple: to measure the speed and magnitude of price changes over a certain period.
What does that mean for traders?
It helps answer the question: Is this market moving too far, too fast?
RSI values range from 0 to 100:
- Above 70 → Overbought (price may be too high and due for a pullback)
- Below 30 → Oversold (price may be too low and due for a bounce)
Key takeaway: RSI is not about predicting the exact top or bottom, but about giving you clues on when momentum might be shifting.
How RSI Works (Simplified for Beginners)
Many traders have the feeling that they need to memorize the relative strength index formula for trading, but actually, it’s not true; just make sure that you know the basics of the RSI. Why RSI is important and what the actual need of relative strength index is in the trading journey.
Example:
- If the price has been mostly rising over the last 14 candles, relative strength index will be high.
- If the price has mostly been falling, relative strength index will be low.
Visual interpretation:
Imagine a speedometer. If it’s near 100, the market is “speeding” upward and might need to slow down. If it’s near 0, it’s speeding downward and might need to bounce.
Think of it like eating cake
- Imagine you like chocolate cake.
- You eat one slice → you feel good.
- You eat three slices → still okay, but starting to feel full.
- You eat ten slices → now you feel sick.
At this point, it’s too much, too fast. Your body needs a break before you can eat more cake.
How is this like the market?
- In the market, instead of cake, its price is going up or down.
- If the price is going up a little bit, it’s ok and it is bearable.
- If it keeps going up a lot in a short time, buyers get “full” — they’ve bought so much that few buyers are left.
- This is overbought — price has risen too much, too quickly, and might soon reverse or slow down.
- Same the other way: if price drops a lot in a short time, sellers get “full” — they’ve sold so much that few sellers are left.
- This is oversold — price has fallen too much, too quickly, and might bounce back up.
RSI’s job is to measure how “full” the market is from buying or selling.
Just like your stomach tells you when you’ve had too much cake, RSI tells traders when the market might be due for a break or reversal.
RSI Levels and Market Interpretation
The relative strength index is a tool that shows how fast and how strong the recent price changes have been.
An RSI reading below 30 typically signals an oversold market, indicating that selling pressure has been excessive and a potential bullish reversal may be imminent. In such cases, traders often begin monitoring for long entry setups.
When the relative strength index falls within the 30–50 range, it reflects subdued momentum and market indecision. Price action during this phase lacks a clear directional bias, so traders generally adopt a wait-and-see approach, seeking confirmation before committing capital.
Values in the 50–70 zone suggest bullish momentum, with buying interest outweighing selling pressure. This range is often associated with continuation patterns, and trend-following strategies may be favorable.
Readings above 70 denote overbought conditions, where buying has been aggressive and may be unsustainable. This increases the likelihood of a corrective pullback, prompting traders to look for profit-taking or short-selling opportunities.

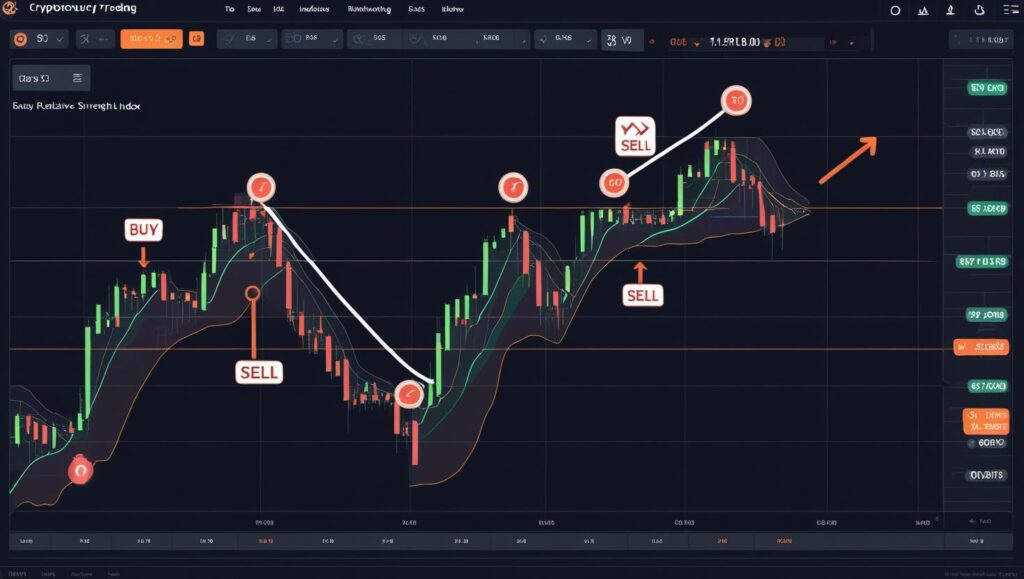
RSI Trading Strategies
The Relative Strength Index (RSI) is more than just a momentum oscillator; it can be the foundation of effective trading strategies when used correctly. By combining relative strength index with other technical tools and adapting it to different market conditions, traders can develop reliable methods for identifying entry and exit points. Below are some proven RSI trading strategies that work across various markets, including forex, stocks, and cryptocurrencies.
1. RSI with Moving Averages
One of the most popular ways to use the RSI is in combination with moving averages. The RSI identifies potential overbought and oversold conditions, while moving averages confirm the broader trend direction.
How it works:
- First, identify the trend using a moving average (such as the 50-day or 200-day MA).
- In an uptrend, wait for RSI to drop near or below 30, signaling a temporary oversold condition within the bullish trend. This can be a buying opportunity.
- In a downtrend, wait for RSI to rise above 70, indicating a short-term overbought condition, which can be a selling opportunity.
This combination helps traders avoid countertrend trades and focus on higher-probability setups.
- RSI in Range-Bound Markets
The RSI is especially effective when the market is trading sideways within a defined range. In such conditions, price oscillates between support and resistance, and RSI provides clear signals for reversals.
How it works:
- Identify horizontal support and resistance levels.
- Buy near support whenrelative strength index is below 30.
- Sell near resistance when RSI is above 70.
This approach works best in markets with low volatility and no strong trend.
- RSI for Short-Term vs. Long-Term Trading
The default relative strength index period is 14, but modifying this setting can change signal sensitivity.
Short-term trading:
- This provides faster signals but may result in more false positives.
- Ideal for day traders and scalpers who need quick entries and exits.
Long-term trading:
- Signals are slower but more reliable.
- Best for swing traders and investors who prefer fewer trades with higher accuracy.
4. Combining RSI with Other Indicators
- RSI + MACD: relative strength index identifies overbought/oversold conditions, while MACD confirms momentum direction.
- RSI + Bollinger Bands: Overbought RSI combined with price touching the upper Bollinger Band can signal a reversal.

Common Mistakes to Avoid When Using the RSI Indicator
The Relative Strength Index (RSI) is a valuable tool for identifying market momentum, potential reversals, and overbought or oversold conditions. However, like any technical indicator, it can produce misleading signals if used incorrectly. Many traders—especially beginners—make avoidable mistakes when applying RSI to their strategies. Recognizing these errors is essential for improving accuracy and avoiding costly trades.
1. Relying Solely on RSI Signals
One of the most common mistakes is treating relative strength index as a standalone buy or sell signal generator. While RSI can identify potential turning points, it should always be confirmed with other tools such as support/resistance levels, moving averages, or candlestick patterns.
For example, just because relative strength index drops below 30 doesn’t guarantee a price rally—prices can stay oversold for a prolonged period, especially in strong downtrends.
2. Ignoring the Market Context
RSI behaves differently depending on whether the market is trending or ranging. In trending markets, RSI can remain overbought or oversold for an extended time without reversing. Traders who ignore this and assume a quick reversal often enter positions too early.
Understanding the broader market context—whether the trend is bullish, bearish, or sideways—can help filter out false signals.
3. Using the Wrong Time Frame
Another frequent error is applying relative strength index to a time frame that doesn’t match your trading style. Day traders may prefer shorter RSI periods (like 7 or 9) for faster signals, while swing traders might benefit from longer periods (14 or 21) for more reliable readings. Using the wrong time frame can lead to either missed opportunities or excessive false alarms.
4. Overtrading Based on Small RSI Movements
RSI is best used for identifying key market conditions, not for chasing every small price movement. Overtrading increases transaction costs and the risk of losses.
5. Misinterpreting Divergences
Divergences—when price and relative strength index move in opposite directions—can be powerful reversal signals, but they are not foolproof. Many traders mistake minor or “hidden” divergences for strong reversal signals. To avoid this, look for divergences that align with other technical confirmations such as trendline breaks or volume changes.
6. Failing to Adjust RSI Settings
The default RSI period of 14 works well for many situations, but it’s not a one-size-fits-all setting. Failing to adjust RSI parameters for different markets or time frames can reduce its effectiveness. For instance, volatile assets may require shorter RSI periods, while stable markets may perform better with longer settings.
Final Tip
Avoiding these common mistakes requires discipline, practice, and a willingness to adapt. The relative strength index is most effective when used alongside other technical analysis tools and within a well-structured trading plan. Remember, no indicator guarantees success—risk management and patience are equally important.

Conclusion & Final Tips for Using the RSI Indicator
The Relative Strength Index (RSI) remains one of the most trusted and widely used momentum oscillators in technical analysis. Its ability to measure the strength of price movements and identify overbought or oversold conditions makes it a valuable addition to any trader’s toolkit. However, its true potential is unlocked only when applied with the right strategy, context, and supporting tools.
Over the course of this guide, we have explored how RSI works, its key levels, different trading strategies, and the common mistakes to avoid. By now, it should be clear that the relative strength index is not meant to be a “magic button” that predicts market movements. Instead, it is a decision-support tool that can improve trade timing when combined with proper market analysis and risk management.
Key Takeaways
- Understand RSI Levels – Readings above 70 indicate potential overbought conditions, while readings below 30 suggest oversold conditions. The 50 level often serves as a midpoint, showing the prevailing momentum.
- Use RSI with Other Indicators – To avoid false signals, confirm RSI readings with tools such as moving averages, trendlines, MACD, or support and resistance zones.
- Adapt RSI Settings – Adjust the RSI period to suit your trading style and the market you’re analyzing. Shorter periods give faster signals but can be more prone to noise, while longer periods are smoother but slower.
- Consider Market Context – relative strength index signals in a trending market behave differently from those in a ranging market. Always identify the overall market structure before making decisions.
- Avoid Overtrading – Do not take trades solely based on RSI crossing certain levels. Wait for a confluence of factors before entering the market.
Best Practices for RSI Trading
- Combine RSI with Price Action: Look for RSI confirmation near key price levels like support, resistance, or trendlines.
- Spot Divergences Carefully: Divergences can be powerful signals, but only when they occur in the right market conditions and are supported by other technical clues.
- Maintain Risk Management: Always use stop-loss orders and avoid risking too much on a single trade.
- Backtest Your Strategy: Before using RSI in live markets, test your approach on historical data to understand how it performs in different conditions.
Final Words
The RSI indicator is like a compass for traders—it won’t drive the ship for you, but it can help you navigate more confidently. When applied with discipline and combined with sound market analysis, RSI can significantly improve trade entries, exits, and overall profitability.
Remember, trading success is not about relying on a single indicator but about building a well-rounded strategy. Treat RSI as a valuable guide, keep refining your approach, and always respect the fundamentals of risk management.
By mastering the RSI and integrating it into your trading plan, you equip yourself with a reliable tool that can serve you well across different markets and time frames.
FAQs
1. Does the RSI truly work in today’s markets?
Traders often ask whether the RSI is still reliable after decades of use. A recent analysis found that while RSI remains a helpful tool for spotting overbought or oversold conditions, it is not a standalone solution for consistent profits. Its effectiveness improves significantly when paired with other technical indicators or strategies.
2. What is the ideal time frame and period setting for the RSI?
This is a common query among traders. The standard setting is a 14-period RSI, which works well for medium-term swing trading. However, for more frequent signals like intraday movements shorter RSI periods (e.g., 2–6) are preferred
3. Is RSI effective across all market types?
People frequently wonder if RSI applies to different instruments like forex, cryptos, or stocks. Yes—it’s widely adaptable and can be used in stocks, forex, commodities, and cryptocurrencies. That said, in strong trending markets, RSI can linger in overbought or oversold zones longer than expected, sometimes triggering false signals
Traders often ask whether the RSI is still reliable after decades of use. A recent analysis found that while RSI remains a helpful tool for spotting overbought or oversold conditions, it is not a standalone solution for consistent profits. Its effectiveness improves significantly when paired with other technical indicators or strategies.
This is a common query among traders. The standard setting is a 14-period RSI, which works well for medium-term swing trading. However, for more frequent signals like intraday movements shorter RSI periods (e.g., 2–6) are preferred
People frequently wonder if RSI applies to different instruments like forex, cryptos, or stocks. Yes—it’s widely adaptable and can be used in stocks, forex, commodities, and cryptocurrencies. That said, in strong trending markets, RSI can linger in overbought or oversold zones longer than expected, sometimes triggering false signals