
Introduction to Stock Market Chart Analysis
Stock market trading is not just about buying and selling shares—it’s about understanding price movements and market behavior. This is where chart analysis plays a crucial role. It helps traders and investors interpret market trends, identify opportunities, and make informed decisions based on data rather than emotions.
At its core, chart analysis involves studying price charts to recognize patterns, trends, and key levels such as support and resistance. These charts visually represent how a stock or asset has performed over time, making it easier to predict possible future movements. Whether you are a beginner or an experienced trader, mastering chart analysis can significantly improve your trading results.
There are different types of charts used in the market, including line charts, bar charts, and candlestick charts. Among these, candlestick charts are the most popular because they provide detailed information about price action within a specific time frame. By learning how to read these charts, traders can better understand market sentiment and momentum through chart analysis.
Another important aspect of chart analysis is identifying trends. Markets generally move in three directions: uptrend, downtrend, and sideways. Recognizing these trends early allows traders to align their strategies with the market direction, increasing the probability of success. Tools like moving averages, trendlines, and indicators further enhance the effectiveness of chart analysis.
In conclusion, chart analysis is an essential skill for anyone interested in the stock market. It transforms complex price data into clear visual insights, helping traders make smarter and more confident decisions. By consistently practicing and studying charts, you can develop a strong foundation in chart analysis and take your trading journey to the next level.
Why Chart Analysis is Important for Beginners?
For anyone starting their journey in trading, understanding the basics of chart analysiss is extremely important. Beginners often enter the market without a clear strategy, relying on guesswork or tips from others. This approach can lead to losses. By learning chart analysiss, beginners can make informed decisions based on real market data instead of emotions.
One of the biggest advantages of chart analysis is that it helps beginners understand market trends. Whether the market is moving up, down, or sideways, charts provide a visual representation of price movements. This allows new traders to identify patterns and avoid entering trades at the wrong time. With proper chart analysis, beginners can improve their timing and increase their chances of success.
Another reason why chart analysis is important is risk management. Charts help traders identify key levels such as support and resistance. These levels act as guides for placing stop-loss and take-profit orders. For beginners, this is crucial because it helps limit losses and protect capital. Without chart analysis, it becomes difficult to manage risk effectively.
Additionally, chart analysis builds confidence in trading decisions. When beginners understand what the charts are showing, they are less likely to panic during market fluctuations. Instead of reacting emotionally, they can rely on their analysis and stick to their strategy. Over time, consistent use of chart analysis helps develop discipline and patience—two essential qualities of successful traders.
Understanding the Basics of Stock Charts
Stock charts are essential tools for traders and investors. They visually represent price movements over time, making it easier to understand how a stock behaves in the market. For beginners, learning the basics of charts is the first step toward mastering chart analysis? and making informed trading decisions.
Stock charts display important information such as price, time, and trading volume. By studying these elements, traders can identify trends, patterns, and potential entry or exit points. A solid understanding of charts forms the foundation of effective chart analysis. and helps reduce reliance on guesswork.
Types of Charts (Line, Bar, Candlestick)
There are three main types of charts commonly used in trading:
1. Line Chart
A line chart is the simplest form of chart. It connects closing prices over a specific period with a line. This type of chart is ideal for beginners because it provides a clear view of the overall trend. However, it lacks detailed information, which limits deeper chart analysis.
2. Bar Chart
A bar chart provides more detailed information than a line chart. Each bar shows the opening price, closing price, high, and low for a specific time period. This makes it useful for traders who want a more comprehensive view of price movements and better chart analysis?.
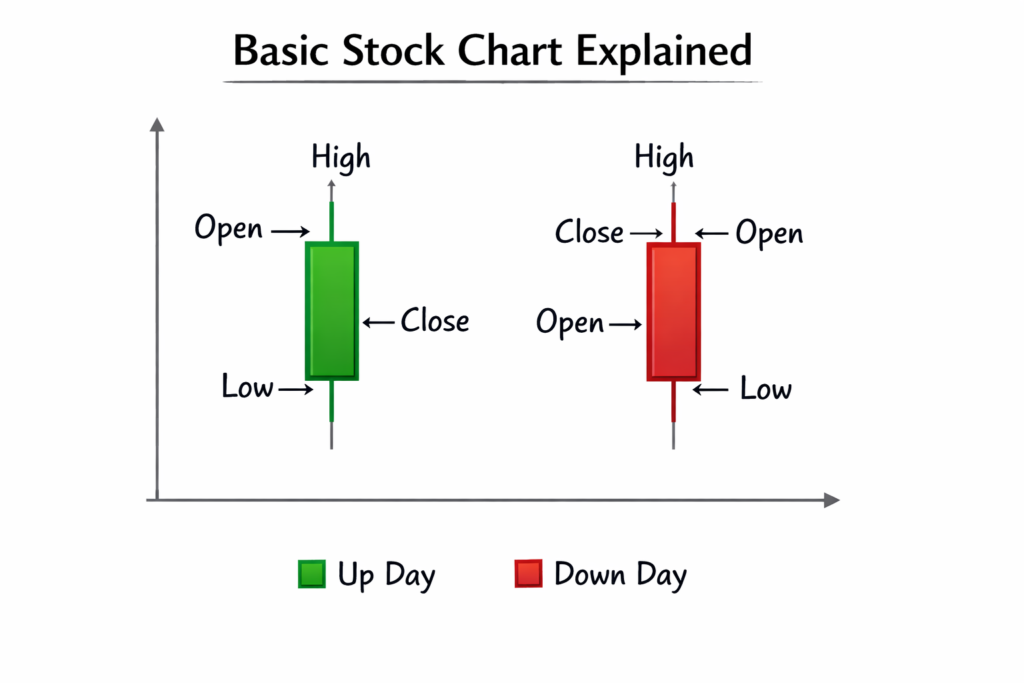
3. Candlestick Chart
Candlestick charts are the most popular among traders. They display the same information as bar charts but in a more visual and easy-to-understand format. Each candlestick shows price movement with colors, helping traders quickly identify bullish or bearish trends. This makes candlestick charts highly effective for chart analysis.
Key Elements of a Chart
To understand stock charts properly, beginners must learn the key elements:
1. Price
The most important element, showing how much a stock is worth at any given time.
2. Time Frame
Charts can represent data from minutes to years. Choosing the right time frame is crucial for accurate analysis.
. Volume
Volume shows how many shares are being traded. High volume often indicates strong market interest.
4. Trend
Trends show the direction of the market—upward, downward, or sideways. Recognizing trends is a core part of chart reading.
5. Support and Resistance
Support is the price level where a stock tends to stop falling, while resistance is where it tends to stop rising. These levels are essential for planning trades.
5 Beginner-Friendly Ways to Analyze Charts in Stock Market Trading
Understanding how to read and interpret charts is a key step toward becoming a successful trader. Beginners don’t need complex strategies to start—just a few simple techniques can make a big difference. Below are five easy and effective ways to begin analyzing charts in stock market trading.
4.1 Identify Market Trends (Uptrend, Downtrend, Sideways)
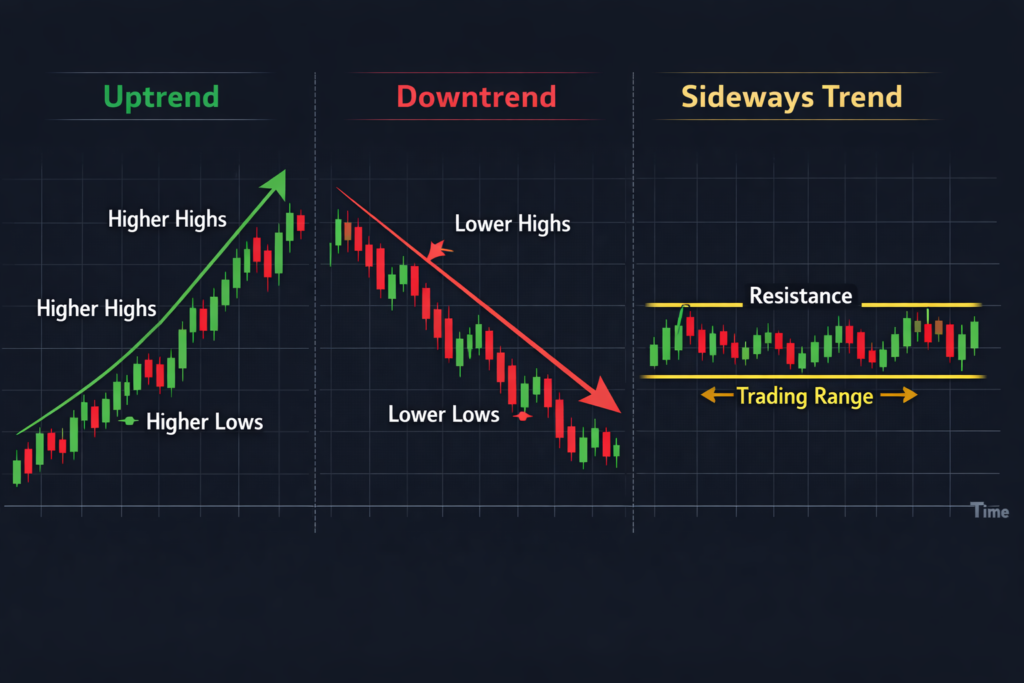
The first step in chart analysis is recognizing the market trend. Markets usually move in three directions:
- Uptrend: Higher highs and higher lows (price is rising)
- Downtrend: Lower highs and lower lows (price is falling)
- Sideways: Price moves within a range without a clear direction
Trading with the trend increases your chances of success. Beginners should avoid going against the trend and instead follow the market direction.
4.2 Use Support and Resistance Levels
Support and resistance are key concepts in chart reading:
- Support: A price level where the market tends to stop falling and bounce back up
- Resistance: A level where the price struggles to move higher and may reverse
These levels help traders decide when to enter or exit trades. Buying near support and selling near resistance is a common beginner strategy.
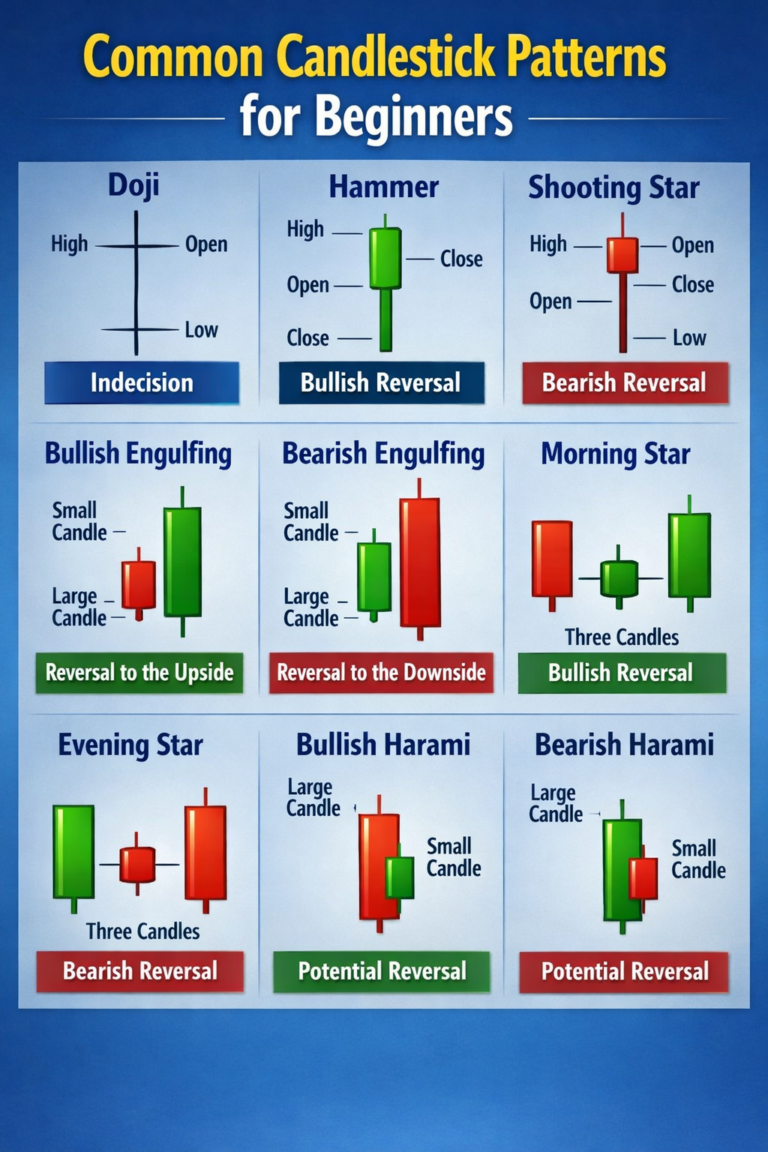
4.3 Learn Basic Candlestick Patterns
Candlestick patterns give insights into market psychology. Some basic patterns every beginner should know include:
- Doji: Indicates market indecision
- Hammer: Suggests a potential reversal after a downtrend
- Engulfing Pattern: Signals a strong reversal
By learning these patterns, beginners can better predict possible price movements and improve their chart reading skills.
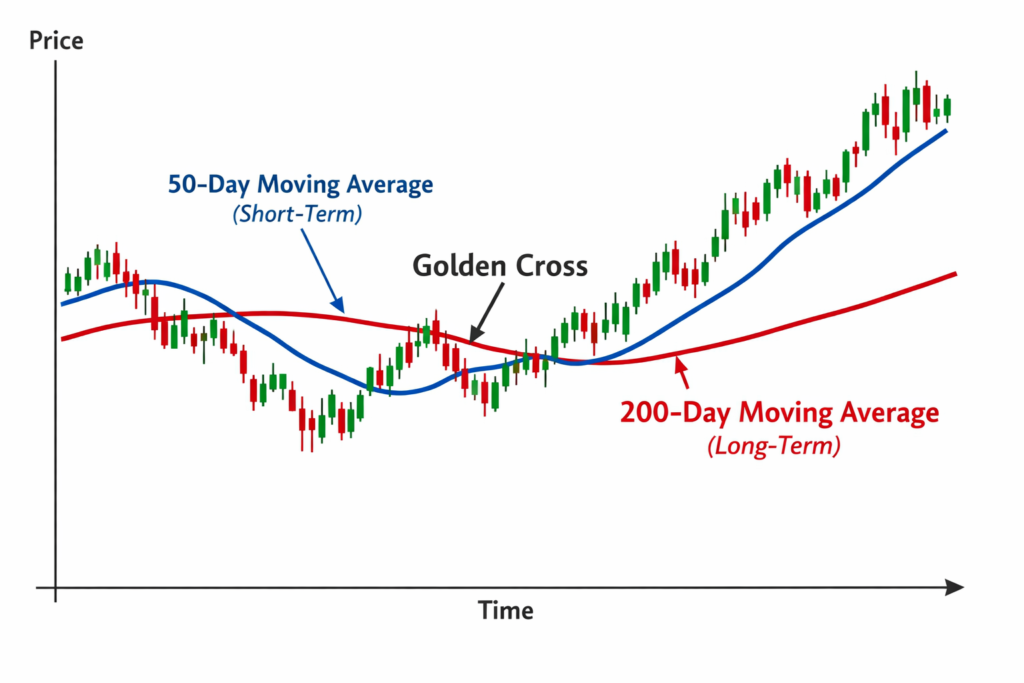
4.4 Apply Moving Averages for Direction
Moving averages are simple yet powerful tools used in chart analysis. They smooth out price data and help identify the overall direction of the market.
- Simple Moving Average (SMA): Calculates the average price over a specific period
- Exponential Moving Average (EMA): Gives more weight to recent prices
When the price is above the moving average, it often indicates an uptrend. When it is below, it may signal a downtrend. Beginners can use moving averages to confirm trends and avoid false signals.
4.5 Analyze Volume for Confirmation
Volume shows how many shares are being traded in the market. It helps confirm the strength of a trend:
- High volume: Strong trend or breakout
- Low volume: Weak movement or possible reversal
For example, if a stock breaks a resistance level with high volume, the breakout is more reliable. Volume adds an extra layer of confirmation to your analysis and helps you make better trading decisions.
Common Mistakes Beginners Should Avoid
Starting your journey in stock market trading can be exciting, but beginners often make simple mistakes that lead to unnecessary losses. By understanding these common errors, you can improve your skills and build a strong foundation in trading and chart analysis.
1. Trading Without a Plan
One of the biggest mistakes beginners make is entering trades without a clear strategy. Random buying and selling based on emotions or tips can be risky. A solid trading plan—based on proper chart analysis—helps you define entry points, exit levels, and risk management rules.
2. Ignoring Risk Management
Many beginners focus only on profits and ignore potential losses. This can quickly wipe out your capital. Always use stop-loss orders and manage your position size wisely. Good chart analysis can help you identify safer levels to place your trades and control risk effectively.
3. Overtrading
New traders often take too many trades in a short period, thinking more trades mean more profit. In reality, overtrading increases losses and stress. It’s better to wait for high-quality setups based on proper chart analysis rather than forcing trades.
4. Not Understanding the Trend
Trading against the market trend is a common beginner mistake. Many traders try to catch reversals too early and end up losing money. Always identify whether the market is in an uptrend, downtrend, or sideways movement before making decisions using chart analysis.
5. Relying on One Indicator Only
Some beginners depend on a single indicator and ignore other important factors. No single tool is perfect. Combine multiple tools like support and resistance, volume, and moving averages for better chart analysis and more accurate decisions.
6. Letting Emotions Control Decisions
Fear and greed are the biggest enemies of traders. Panic selling or holding onto losing trades can lead to bigger losses. Staying disciplined and following your chart analysis strategy helps you make rational decisions.
7. Skipping Practice and Learning
Many beginners jump into live trading without enough practice. This often results in avoidable mistakes. Spend time learning, backtesting strategies, and improving your chart analysis skills before risking real money.
Simple Tips to Improve Your Chart Analysis Skills
Improving your trading performance starts with sharpening your chart analysis skills. While beginners often feel overwhelmed by charts, a few simple and consistent habits can make a big difference over time. Here are practical tips to help you master chart analysis and trade with more confidence.
1. Focus on One Chart Type First
Instead of trying to learn everything at once, start with one chart type—preferably candlestick charts. They provide clear and detailed information about price movements. Mastering one format will make your chart analysis more effective and less confusing.
2. Practice Daily
Consistency is key in trading. Spend time every day looking at charts, even if you’re not trading. The more you practice, the better you’ll recognize patterns and trends. Regular practice strengthens your chart analysis skills over time.
3. Keep Your Charts Clean
Many beginners overload their charts with too many indicators. This creates confusion instead of clarity. Use only a few important tools, like support/resistance and moving averages, to keep your chart analysis simple and effective.
4. Learn from Past Charts
Go back and study historical price movements. Identify where trends started, where reversals happened, and how patterns formed. This helps you understand how markets behave and improves your chart analysis accuracy.
5. Combine Multiple Signals
Don’t rely on a single indicator or pattern. Always confirm your trades using multiple signals like trend direction, volume, and key levels. This approach makes your chart analysis more reliable and reduces false signals.
6. Use a Trading Journal
Record your trades along with screenshots of charts and your reasons for entering or exiting. Reviewing your past trades helps you learn from mistakes and refine your chart analysis strategy.
Conclusion: Start Simple and Stay Consistent
Success in stock market trading doesn’t come from using complicated strategies—it comes from mastering the basics and applying them consistently. For beginners, the best approach is to start simple and focus on building a strong foundation in chart analysis.
By understanding trends, support and resistance, candlestick patterns, and volume, you can gradually improve your decision-making skills. There’s no need to rush or try to learn everything at once. Consistent practice and patience will naturally strengthen your chart analysis over time.
Remember, even experienced traders rely on simple techniques—they just use them with discipline and confidence. Stick to a clear plan, avoid common mistakes, and keep learning from your experiences.
Frequently Asked Questions
1. What is chart analysis in stock trading?
Chart analysis is the process of studying price charts to understand market trends, patterns, and potential future movements. It helps traders make informed decisions based on data rather than guesswork.
2. Why is chart analysis important for beginners?
Chart analysis helps beginners understand how the market behaves. It improves decision-making, reduces emotional trading, and helps identify better entry and exit points.
3. Which chart is best for beginners?
Candlestick charts are considered the best for beginners because they provide detailed and easy-to-read information about price movements and market sentiment.
Chart analysis is the process of studying price charts to understand market trends, patterns, and potential future movements. It helps traders make informed decisions based on data rather than guesswork.
Chart analysis helps beginners understand how the market behaves. It improves decision-making, reduces emotional trading, and helps identify better entry and exit points.
Candlestick charts are considered the best for beginners because they provide detailed and easy-to-read information about price movements and market sentiment.