
Table of Contents
ToggleWhat Is the Gold Breakout Strategy?
The Gold Breakout Strategy is a trading method that helps traders enter the market when the price of gold breaks above a resistance level or below a support level with strong momentum. Instead of predicting market direction, traders wait for confirmation that buyers or sellers have taken control before opening a trade.
The main objective of the Gold Breakout Strategy is to capture large price movements that often occur after the market breaks out of a consolidation or trading range. Gold frequently moves sideways before major economic news or during periods of low volatility. Once the breakout happens, the price can move rapidly, creating profitable trading opportunities.
A successful Gold Breakout Strategy requires more than simply trading every breakout. Traders should confirm the breakout with higher trading volume, strong candlestick patterns, or momentum indicators to avoid false breakouts. Waiting for a candle to close above resistance or below support can significantly improve trade accuracy.
The Gold Breakout Strategy works on multiple timeframes, including the 5-minute, 15-minute, 1-hour, 4-hour, and daily charts. Day traders often use lower timeframes for quick trades, while swing traders prefer higher timeframes to capture larger market moves.
Overall, the Gold Breakout Strategy is one of the most effective price action techniques for trading XAU/USD. When combined with proper risk management, trend analysis, and confirmation signals, the Gold Breakout Strategy can help traders identify high-probability entry opportunities while reducing the risk of false breakouts.
How Does a Gold Breakout Work?
The Gold Breakout Strategy works by identifying important support and resistance levels where the price of gold has been moving within a defined range. When the price finally breaks above resistance or below support with strong momentum, it signals that buyers or sellers have taken control of the market. Traders then use the Gold Breakout Strategy to enter trades in the direction of the breakout.
Here is how the Gold Breakout Strategy works step by step:
1. Identify a Consolidation Range
The first step is to find a period where gold is trading sideways. During consolidation, the price repeatedly bounces between support and resistance without creating a clear trend. These levels become the potential breakout zones.
2. Mark Support and Resistance
Draw horizontal lines around the highest and lowest points of the consolidation area. These price levels are where the breakout is most likely to occur and form the foundation of the Gold Breakout Strategy.
3. Wait for the Breakout
Do not enter a trade while the price is still inside the range. Instead, wait for a strong candlestick to close above resistance for a buy trade or below support for a sell trade. Patience is one of the most important parts of the Gold Breakout Strategy.
4. Confirm the Breakout
A valid breakout is usually supported by strong bullish or bearish candles, increased trading volume, or momentum indicators. Confirmation helps traders avoid false breakouts that quickly reverse.
5. Enter the Trade
Once the breakout is confirmed, enter the trade in the direction of the breakout. Place the stop loss below the breakout level for buy trades or above the breakout level for sell trades. Set your take-profit target based on the next key support or resistance level or by using a favorable risk-to-reward ratio.
When traders follow these steps with discipline, the Gold Breakout Strategy helps them capture strong market moves while minimizing the risk of entering false breakouts. Proper confirmation and risk management are the keys to making the Gold Breakout Strategy consistently effective.
Why Breakouts Happen in Gold
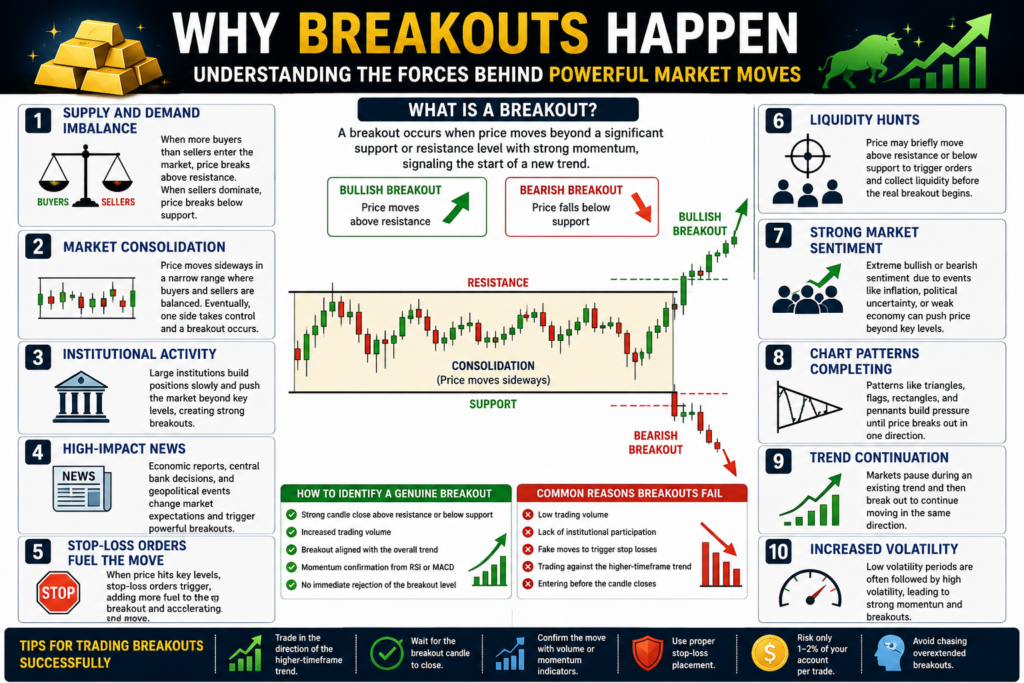
Breakouts in the gold market occur when buying or selling pressure becomes strong enough to push the price beyond an important support or resistance level. The Gold Breakout Strategy helps traders identify these moments and take advantage of the new trend before it gains momentum.
Here are the main reasons why breakouts happen in gold:
1. High-Impact Economic News
Major economic events such as Federal Reserve (FOMC) meetings, Non-Farm Payroll (NFP) reports, Consumer Price Index (CPI) data, and GDP releases can cause sudden increases in market volatility. The Gold Breakout Strategy is often most effective during these events because gold can move sharply after the news is released.
2. Strong Buying or Selling Pressure
When institutional traders, banks, and large investors place significant buy or sell orders, the market can no longer remain within its trading range. Once support or resistance is broken, the Gold Breakout Strategy allows traders to follow the new market direction.
3. Market Consolidation Ends
Gold often trades sideways before making a large move. During this consolidation phase, buyers and sellers are evenly matched. Eventually, one side gains control, causing a breakout. This is one of the most common market conditions used in the Gold Breakout Strategy.
4. Liquidity Above Resistance and Below Support
Many stop-loss and pending orders are placed around key support and resistance levels. When the price reaches these areas, those orders are triggered, creating additional buying or selling pressure. This extra momentum can produce a strong breakout that traders look for using the Gold Breakout Strategy.
5. Trend Continuation
A breakout does not always signal a new trend. Sometimes it simply confirms that the existing trend is continuing. For example, during a strong uptrend, gold may consolidate before breaking above resistance and continuing higher. In these situations, the Gold Breakout Strategy helps traders enter the trend with greater confidence.
Understanding why breakouts happen is essential for successful gold trading. By recognizing the market conditions that lead to breakouts and applying the Gold Breakout Strategy with proper confirmation and risk management, traders can improve their chances of identifying high-probability trading opportunities.
Types of Gold Breakouts
Understanding the different types of breakouts is essential for applying the Gold Breakout Strategy successfully. Not every breakout is the same, and recognizing the type of breakout can help traders choose better entry points and avoid unnecessary losses.
1. Bullish Breakout
A bullish breakout occurs when the price of gold moves above a strong resistance level with high momentum. This indicates that buyers have gained control of the market and the price may continue moving higher.
The Gold Breakout Strategy considers a bullish breakout valid when the candle closes above resistance and is supported by strong volume or bullish momentum. Traders usually look for buy opportunities after confirmation.
2. Bearish Breakout
A bearish breakout happens when gold falls below an important support level. This suggests that sellers have taken control, and the market may continue moving downward.
Using the Gold Breakout Strategy, traders wait for a confirmed close below support before entering a sell trade. This helps reduce the risk of trading false breakdowns.
3. Continuation Breakout
A continuation breakout occurs when gold pauses during an existing trend, forms a consolidation pattern, and then breaks out in the same direction as the trend.
This is one of the highest-probability setups in the Gold Breakout Strategy because the breakout aligns with the overall market direction. Many professional traders prefer continuation breakouts over reversal trades.
4. Reversal Breakout
A reversal breakout signals a potential change in trend. For example, after a long downtrend, gold may break above a major resistance level, indicating that buyers are taking control. Likewise, after a strong uptrend, a break below support may signal the start of a bearish trend.
The Gold Breakout Strategy uses additional confirmation, such as trend reversal patterns or momentum indicators, before trading reversal breakouts.
5. False Breakout
A false breakout occurs when the price briefly moves above resistance or below support but quickly reverses back into the previous trading range. These breakouts often trap traders who enter too early.
To avoid false signals, the Gold Breakout Strategy recommends waiting for a candle to close beyond the breakout level and confirming the move with volume, market structure, or other technical indicators.
Best Timeframes for Gold Breakout Trading
Choosing the right timeframe is one of the most important factors for the success of the Gold Breakout Strategy. Different timeframes suit different trading styles, and using the appropriate chart can help traders identify stronger breakout opportunities while reducing false signals.
1. 5-Minute Chart (M5)
The 5-minute chart is ideal for scalpers and short-term traders who want to capture quick price movements. The Gold Breakout Strategy on this timeframe works best during high-volatility sessions, such as the London and New York market overlap. Since false breakouts are more common, traders should wait for strong confirmation before entering a trade.
2. 15-Minute Chart (M15)
The 15-minute timeframe is popular among intraday traders because it offers a balance between trading opportunities and signal quality. Many traders use the Gold Breakout Strategy on the M15 chart to identify breakouts from support and resistance levels while avoiding excessive market noise.
3. 1-Hour Chart (H1)
The 1-hour chart provides more reliable breakout signals than lower timeframes. It is suitable for day traders who want to hold positions for several hours. The Gold Breakout Strategy on the H1 timeframe often produces stronger trends and fewer false breakouts compared to the 5-minute and 15-minute charts.
4. 4-Hour Chart (H4)
The 4-hour timeframe is a favorite among swing traders. Breakouts on this chart are usually more significant because they represent stronger market sentiment. Applying the Gold Breakout Strategy on the H4 chart allows traders to target larger price movements with fewer trades.
5. Daily Chart (D1)
The daily chart is best for long-term traders and investors. Breakouts on the daily timeframe are generally the most reliable because they reflect major changes in market direction. The Gold Breakout Strategy on the daily chart helps traders capture long-term trends while filtering out short-term market fluctuations.
Which Timeframe Is Best?
There is no single “best” timeframe for every trader. Your choice depends on your trading style:
- Scalpers: 5-Minute (M5)
- Day Traders: 15-Minute (M15) and 1-Hour (H1)
- Swing Traders: 4-Hour (H4)
- Position Traders: Daily (D1)
For the highest-probability trades, many experienced traders combine multiple timeframes. For example, they use the 4-hour or daily chart to identify the overall trend and the 15-minute or 1-hour chart to find precise breakout entries. This multi-timeframe approach makes the Gold Breakout Strategy more accurate and helps traders trade in the direction of the dominant market trend.
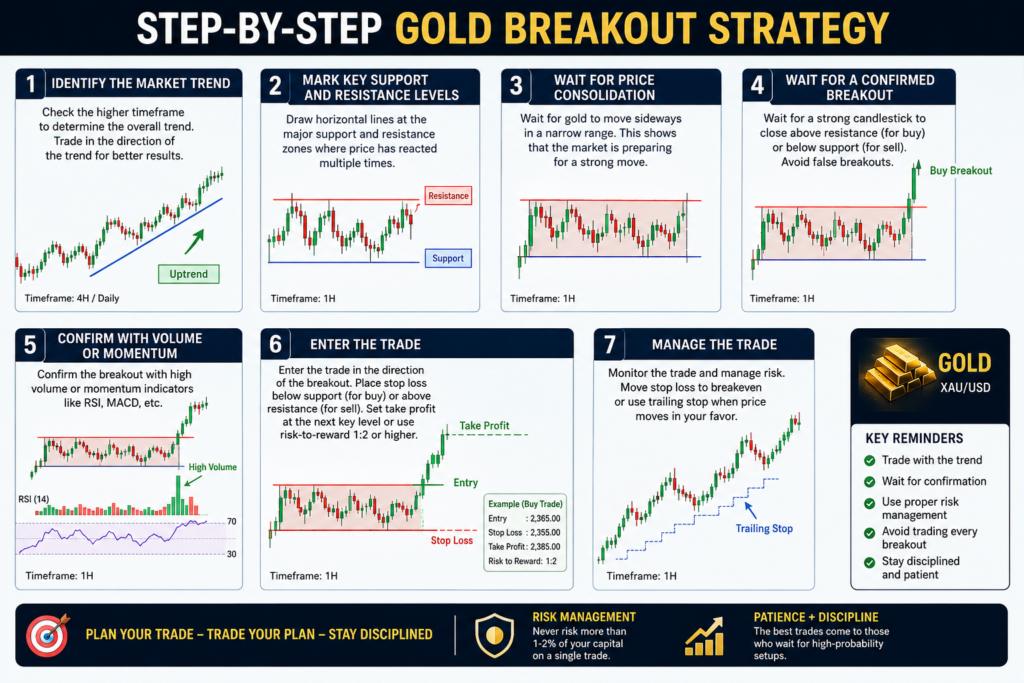
Step-by-Step Gold Breakout Strategy
Following a structured trading plan is essential for success. The Gold Breakout Strategy becomes much more effective when every trade follows the same process instead of relying on emotions or guesswork. Below is a step-by-step guide to using the Gold Breakout Strategy in the gold market.
Step 1: Identify the Market Trend
Before looking for a breakout, determine the overall market trend. Use higher timeframes such as the 1-hour, 4-hour, or daily chart to see whether gold is trending upward, downward, or moving sideways.
Trading in the direction of the trend increases the probability of success. The Gold Breakout Strategy performs best when breakouts occur in line with the prevailing trend.
Step 2: Mark Key Support and Resistance Levels
Draw horizontal lines at the most important support and resistance zones where the price has reacted multiple times. These levels are where breakouts are most likely to occur.
A well-defined trading range is the foundation of the Gold Breakout Strategy because breakouts begin when price moves beyond these key levels.
Step 3: Wait for Price Consolidation
Avoid entering trades while the market is moving aggressively. Instead, wait for gold to consolidate within a narrow range. Consolidation shows that buyers and sellers are temporarily balanced before a strong move.
The longer the consolidation period, the stronger the breakout can be, making the Gold Breakout Strategy more reliable.
Step 4: Wait for a Confirmed Breakout
Do not enter immediately when the price touches support or resistance. Wait for a strong candlestick to close above resistance for a buy trade or below support for a sell trade.
Confirmation helps reduce the risk of false breakouts, which is one of the most important rules of the Gold Breakout Strategy.
Step 5: Confirm with Volume or Momentum
A breakout is more trustworthy when it is supported by increased trading volume or momentum indicators such as RSI or MACD. Strong momentum shows that buyers or sellers are committed to the move.
Using confirmation tools improves the accuracy of the Gold Breakout Strategy and filters out weak breakout signals.
Step 6: Enter the Trade
Once the breakout is confirmed, enter the trade in the direction of the breakout. Place your stop loss below the breakout level for buy trades or above the breakout level for sell trades.
Set your take-profit target using the next support or resistance level or maintain a minimum risk-to-reward ratio of 1:2.
Step 7: Manage the Trade
After entering the position, monitor the trade carefully. As the price moves in your favor, consider moving your stop loss to breakeven or using a trailing stop to protect profits.
Proper trade management is a key part of the Gold Breakout Strategy because it helps maximize gains while limiting potential losses.
Conclusion
A disciplined approach is the key to consistent trading results. By identifying the trend, marking support and resistance, waiting for consolidation, confirming the breakout, and managing risk effectively, traders can use the Gold Breakout Strategy to capture high-probability opportunities in the gold market. Consistently
Indicators That Improve Breakout Accuracy.
While price action is the foundation of the Gold Breakout Strategy, technical indicators can help traders confirm breakouts and avoid false signals. Using the right indicators alongside support and resistance levels can significantly improve trading accuracy and confidence.
1. Volume Indicator
Volume is one of the most reliable tools for confirming a breakout. A genuine breakout is often accompanied by a noticeable increase in trading volume, showing that strong buying or selling pressure is driving the move.
When using the Gold Breakout Strategy, look for higher-than-average volume as the price breaks above resistance or below support. Low-volume breakouts are more likely to fail and reverse.
2. Relative Strength Index (RSI)
The Relative Strength Index (RSI) measures market momentum and helps identify whether buyers or sellers are gaining strength.
In the Gold Breakout Strategy, an RSI reading above 50 during a bullish breakout indicates increasing buying momentum, while a reading below 50 during a bearish breakout suggests stronger selling pressure. RSI can also help identify overbought and oversold conditions.
3. Moving Averages (EMA)
Exponential Moving Averages (EMAs), such as the 20 EMA and 50 EMA, help traders determine the overall market trend.
The Gold Breakout Strategy becomes more reliable when bullish breakouts occur above the moving averages and bearish breakouts occur below them. Trading in the direction of the trend generally increases the probability of success.
4. MACD (Moving Average Convergence Divergence)
The MACD is a popular momentum indicator that helps confirm trend strength and potential breakout direction.
When applying the Gold Breakout Strategy, a bullish MACD crossover supports buy breakouts, while a bearish crossover supports sell breakouts. The MACD histogram can also indicate whether momentum is increasing after the breakout.
5. Bollinger Bands
Bollinger Bands measure market volatility and can signal when a strong price move is about to occur.
During the Gold Breakout Strategy, a period of narrow Bollinger Bands often indicates low volatility and market consolidation. When the bands begin to expand and the price breaks out of the range, it may signal the start of a strong trend.
6. Average True Range (ATR)
The Average True Range (ATR) measures market volatility rather than price direction.
In the Gold Breakout Strategy, an increasing ATR after a breakout suggests that volatility is expanding and the breakout has the potential to continue. ATR can also help traders set more realistic stop-loss and take-profit levels.
7. Fibonacci Retracement
Fibonacci Retracement levels help traders identify potential pullback zones after a breakout.
Many traders using the Gold Breakout Strategy wait for the price to retrace to the 38.2%, 50%, or 61.8% Fibonacci levels before entering a trade. This approach can provide better entry prices while maintaining favorable risk-to-reward ratios.
Best Indicator Combination for the Gold Breakout Strategy
Instead of relying on a single indicator, combine multiple confirmation tools for higher-probability trades. A simple and effective combination includes:
- Support and Resistance to identify breakout levels.
- Volume to confirm strong market participation.
- 20 EMA or 50 EMA to determine the overall trend.
- RSI or MACD to confirm momentum.
- ATR to measure volatility and manage risk.