Table of Contents
ToggleIntroduction
Gold has always been one of the most traded financial assets in the world because of its high liquidity, strong price movements, and reputation as a safe-haven investment during economic uncertainty. Whether the market is reacting to inflation, central bank decisions, or geopolitical events, gold often provides excellent trading opportunities for both beginners and experienced traders. This is why many traders constantly search for the Best TradingView Indicators for Gold to improve their market analysis and make more informed trading decisions.
TradingView has become the preferred charting platform for millions of traders worldwide. Its user-friendly interface, real-time market data, customizable charts, and extensive library of technical indicators make it an excellent choice for gold traders. With TradingView, you can analyze price action, spot trends, identify support and resistance levels, and build trading strategies using the Best TradingView Indicators for Gold without needing expensive software.
Technical indicators play a crucial role in helping traders identify market trends, momentum shifts, volatility, and potential entry and exit points. Instead of relying solely on guesswork, traders use indicators to confirm price action and increase the probability of successful trades. The Best TradingView Indicators for Gold can help filter out market noise, reduce emotional decision-making, and provide greater confidence before placing a trade.
However, it is important to understand that no indicator is 100% accurate. Every technical indicator has strengths and weaknesses, and market conditions can change quickly. Depending on only one tool may result in false signals or missed opportunities. That is why experienced traders combine the Best TradingView Indicators for Gold with price action, support and resistance analysis, proper risk management, and multiple indicator confirmations. This approach significantly improves the chances of finding high-probability trading setups while minimizing unnecessary risks.
In this guide, you’ll discover the Best TradingView Indicators for Gold, learn how each one works, and understand how combining them can help you develop a more consistent and profitable gold trading strategy.
Why Use TradingView for Gold Trading?
If you want to trade gold effectively, having the right charting platform is just as important as having a good trading strategy. TradingView is one of the most popular platforms among beginner and professional traders because it offers powerful tools, an intuitive interface, and advanced market analysis features—all in one place. When combined with the Best TradingView Indicators for Gold, TradingView helps traders identify trends, confirm trade setups, and make more confident trading decisions.
Real-Time Charts
Gold prices can change rapidly, especially during major market sessions like the London and New York opens. TradingView provides real-time charts that allow traders to monitor price movements as they happen. By using the Best TradingView Indicators for Gold on live charts, you can react quickly to changing market conditions and avoid missing profitable opportunities.
Hundreds of Free Indicators
One of TradingView’s biggest advantages is its extensive library of built-in technical indicators. From moving averages and RSI to MACD, Bollinger Bands, and ATR, traders have access to hundreds of free tools. Many of the Best TradingView Indicators for Gold are already included, making it easy to analyze the market without purchasing expensive software.
Custom Indicators
TradingView also supports custom indicators created using Pine Script. Thousands of traders and developers have shared unique indicators specifically designed for gold trading, trend analysis, and price action. These custom tools can complement the Best TradingView Indicators for Gold and help you develop a trading strategy that matches your personal style.
Easy-to-Use Chart Layouts
A clean and organized chart makes analysis much easier. TradingView allows you to customize layouts by adding multiple indicators, drawing trendlines, marking support and resistance levels, and saving your preferred templates. This flexibility enables traders to combine the Best TradingView Indicators for Gold with price action for a clearer view of the market.
Smart Price Alerts
You don’t have to watch your charts all day. TradingView lets you create customizable alerts based on price levels, indicator signals, or trendline breaks. When your trading conditions are met, you’ll receive an instant notification. This feature ensures you never miss a potential setup identified by the Best TradingView Indicators for Gold, even when you’re away from your computer.
Multi-Timeframe Analysis
Successful gold traders rarely rely on a single timeframe. TradingView makes it easy to switch between 1-minute, 15-minute, 1-hour, 4-hour, and daily charts within seconds. Multi-timeframe analysis helps traders confirm trends, identify stronger entry points, and avoid false signals before placing a trade.
Community Scripts and Ideas
TradingView has a large global community where traders share custom scripts, market analysis, and trading ideas every day. You can explore strategies created by experienced traders, test different indicators, and learn new techniques. While community scripts can be valuable, always test them on a demo account before using them with real money.
TradingView combines powerful charting tools, real-time data, advanced customization, and a massive trading community into one platform. Whether you’re a beginner or an experienced trader, using the Best TradingView Indicators for Gold alongside TradingView’s features can significantly improve your market analysis and help you identify higher-probability trading opportunities.
1. Exponential Moving Average (EMA)
The Exponential Moving Average (EMA) is one of the Best TradingView Indicators for Gold because it reacts quickly to price changes and helps traders identify the overall market trend. Unlike the Simple Moving Average (SMA), the EMA gives more weight to recent price action, making it ideal for the fast-moving gold market. Whether you are a day trader or a swing trader, the EMA can help you find high-probability entries while filtering out market noise.
Best EMA Settings for Gold
The following EMA settings are widely used by professional gold traders:
- 20 EMA – Identifies short-term trends and momentum.
- 50 EMA – Confirms medium-term trend direction.
- 200 EMA – Defines the long-term market trend and major support or resistance.
Using these three EMAs together is considered one of the Best TradingView Indicators for Gold combinations because they provide a complete view of short-, medium-, and long-term market conditions.
20 EMA – Short-Term Trend
The 20 EMA closely follows the price and is perfect for identifying short-term momentum. During a strong uptrend, gold often pulls back to the 20 EMA before continuing higher. In a downtrend, the 20 EMA frequently acts as a rejection level where sellers regain control.
Scalpers and intraday traders commonly use the 20 EMA to find quick entry opportunities during trending markets.
50 EMA – Medium-Term Trend Confirmation
The 50 EMA is a reliable indicator for confirming the overall direction of the market. When the gold price remains above the 50 EMA, buyers are generally in control. When the price trades below it, sellers have the advantage.
Many traders combine the 20 EMA and 50 EMA to identify trend continuation setups. This combination is one of the Best TradingView Indicators for Gold because it helps reduce false signals while improving trade confirmation.
200 EMA – Long-Term Trend Filter
The 200 EMA is one of the most respected moving averages in technical analysis. It represents the long-term trend and is watched by institutional traders around the world.
- Price above the 200 EMA indicates a bullish market.
- Price below the 200 EMA suggests a bearish market.
Many experienced traders only take buy trades when gold is above the 200 EMA and sell trades when it is is below the 200 EMA. This simple filter can significantly improve trading accuracy.
How EMA Helps Gold Traders
1. Identifies Trend Direction
The EMA clearly shows whether the market is trending upward or downward. Instead of guessing the trend, traders can use the position and slope of the EMA to determine the market direction.
- Price above the EMA = Bullish trend
- Price below the EMA = Bearish trend
This is one reason why the EMA remains one of the Best TradingView Indicators for Gold.
2. Acts as Dynamic Support
During an uptrend, the EMA often acts as dynamic support. Instead of falling all the way to a horizontal support level, gold frequently bounces from the 20 EMA or 50 EMA before continuing higher.
These pullbacks often provide excellent buying opportunities with favorable risk-to-reward ratios.
3. Acts as Dynamic Resistance
In a downtrend, the EMA becomes dynamic resistance. Gold prices often retrace upward, touch the EMA, and then continue moving lower as sellers step back into the market.
This helps traders identify potential sell entries with greater confidence.
4. Confirms Trend Continuation
One of the greatest strengths of the EMA is confirming whether an existing trend is likely to continue. If the price repeatedly respects the 20 EMA or 50 EMA while making higher highs and higher lows, it signals that buyers remain in control. Similarly, repeated rejections from the EMA during a downtrend indicate continued selling pressure.
By combining the 20 EMA, 50 EMA, and 200 EMA with price action, traders can filter out weak setups and focus on higher-probability trades. This is why many professional traders consider the EMA one of the Best TradingView Indicators for Gold for consistent trend analysis and trade execution.
2. Relative Strength Index (RSI)
The Relative Strength Index (RSI) is one of the Best TradingView Indicators for Gold because it measures the speed and strength of price movements. Developed by J. Welles Wilder, RSI is a momentum oscillator that ranges from 0 to 100, helping traders determine whether gold is overbought, oversold, or gaining momentum.
RSI is especially useful for gold traders because XAU/USD often experiences strong price swings. By using RSI alongside trend-following indicators like the EMA, traders can identify higher-probability entry and exit points while avoiding trades against the dominant trend.
Best RSI Settings for Gold
The most commonly used RSI settings are:
- RSI 14 – Best for swing trading and general trend analysis.
- RSI 7 – Ideal for scalping and short-term trading.
RSI 14 – The Standard Setting
The RSI 14 is the default setting used by most professional traders. It provides a balanced view of market momentum without generating too many false signals. This setting works well on 15-minute, 1-hour, 4-hour, and daily charts, making it one of the Best TradingView Indicators for Gold for both beginners and experienced traders.
RSI 7 – Best for Scalping
If you trade on the 1-minute or 5-minute charts, the RSI 7 is a faster alternative. It reacts more quickly to price movements, allowing scalpers to spot short-term reversals and momentum shifts earlier.
However, because RSI 7 is more sensitive, it can produce more false signals. Many traders combine it with the 20 EMA or price action confirmation before entering a trade.
How RSI Helps Gold Traders
1. Identifies Overbought Conditions
When the RSI rises above 70, gold is considered overbought. This means the price has moved upward rapidly and may be due for a pullback or short-term correction.
An overbought RSI does not automatically mean you should sell. During strong bullish trends, gold can remain above 70 for an extended period. It is always better to wait for additional confirmation before opening a trade.
2. Identifies Oversold Conditions
When the RSI falls below 30, gold is considered oversold. This suggests that selling pressure may be weakening and buyers could soon enter the market.
Like overbought conditions, an oversold reading is not an immediate buy signal. Combining RSI with support levels, candlestick patterns, or moving averages can improve the accuracy of your trades.
3. Spots RSI Divergence
RSI divergence is one of the most powerful signals available to gold traders.
- Bullish Divergence: Gold forms a lower low while RSI forms a higher low. This indicates that bearish momentum is weakening and a bullish reversal may be approaching.
- Bearish Divergence: Gold forms a higher high while RSI forms a lower high. This suggests that buying momentum is fading and the market could reverse downward.
Many experienced traders consider RSI divergence one of the Best TradingView Indicators for Gold signals because it can provide early warning signs of potential trend reversals.
4. Measures Market Momentum
The RSI is primarily a momentum indicator, showing whether buyers or sellers currently have control of the market.
- Rising RSI indicates increasing bullish momentum.
- Falling RSI indicates increasing bearish momentum.
- RSI staying above 50 usually supports an uptrend.
- RSI remaining below 50 often confirms a downtrend.
Understanding momentum helps traders avoid entering trades when the market lacks strength and focus on higher-probability setups.
Pro Tip for Better Accuracy
Although RSI is one of the Best TradingView Indicators for Gold, it performs best when combined with other technical tools. For example:
- Use the 20 EMA and 50 EMA to identify the trend.
- Use RSI 14 to confirm momentum.
- Wait for price action confirmation, such as bullish or bearish candlestick patterns, before entering a trade.
By combining trend analysis with RSI signals, traders can filter out false entries and significantly improve their overall trading performance.
3. Average True Range (ATR)
The Average True Range (ATR) is one of the Best TradingView Indicators for Gold because it measures market volatility rather than trend direction. Developed by J. Welles Wilder, ATR helps traders understand how much gold typically moves during a specific period. Since gold (XAU/USD) is known for its sharp price swings, ATR is an essential tool for setting realistic stop losses and take profit targets.
Unlike indicators that tell you whether to buy or sell, ATR tells you how much the market is likely to move. This information helps traders manage risk more effectively and avoid being stopped out by normal market fluctuations.
Best ATR Setting for Gold
The most widely used setting is:
- ATR 14 – Suitable for scalping, day trading, swing trading, and long-term trading.
The ATR 14 calculates the average price range over the last 14 candles, providing a reliable measure of current market volatility. This is why many professional traders include it among the Best TradingView Indicators for Gold.
How ATR Helps Gold Traders
1. Measures Market Volatility
The primary purpose of the ATR is to measure how volatile the gold market is.
- High ATR value = High volatility and larger price movements.
- Low ATR value = Low volatility and smaller price movements.
For example, during major economic news releases such as Non-Farm Payrolls (NFP) or Federal Reserve announcements, the ATR usually increases as gold experiences larger price swings. During quiet trading sessions, the ATR decreases, indicating lower volatility.
Understanding volatility helps traders decide whether current market conditions match their trading strategy.
2. Helps Set Better Stop Loss Levels
One of the biggest mistakes traders make is placing stop losses too close to their entry price. Gold often makes normal price fluctuations before continuing in the expected direction.
The ATR helps solve this problem by showing the market’s average movement. Instead of choosing a random stop loss, traders can place it beyond the normal price range indicated by the ATR.
Using the ATR for stop-loss placement reduces the chances of being stopped out by ordinary market noise, making it one of the Best TradingView Indicators for Gold for risk management.
3. Improves Take Profit Targets
ATR is also useful for setting realistic profit targets. Since it estimates how far gold typically moves during a given period, traders can avoid setting take-profit levels that are either too small or unrealistically large.
For example:
- During high volatility, traders may target larger price moves.
- During low volatility, smaller profit targets are often more realistic.
This approach helps traders maintain a balanced risk-to-reward ratio while adapting to changing market conditions.
4. Helps Avoid Tight Stop Losses
Gold is one of the most volatile trading instruments, and tight stop losses are frequently triggered before the market resumes its original trend.
ATR allows traders to adjust their stop-loss distance according to current volatility. When volatility increases, a wider stop loss may be appropriate. When volatility decreases, a tighter stop loss can be used without exposing the trade to unnecessary risk.
This flexibility is one of the main reasons ATR is considered one of the Best TradingView Indicators for Gold by experienced traders.
Pro Tip for Using ATR in Gold Trading
ATR does not indicate whether the market is bullish or bearish—it only measures volatility. For the best results, combine the Best TradingView Indicators for Gold by using:
- EMA (20, 50, and 200) to identify the trend.
- RSI (14) to confirm momentum.
- ATR (14) to determine appropriate stop-loss and take-profit levels.
Using these indicators together provides a complete trading framework, helping you identify high-probability setups while managing risk more effectively.
4. Volume Profile
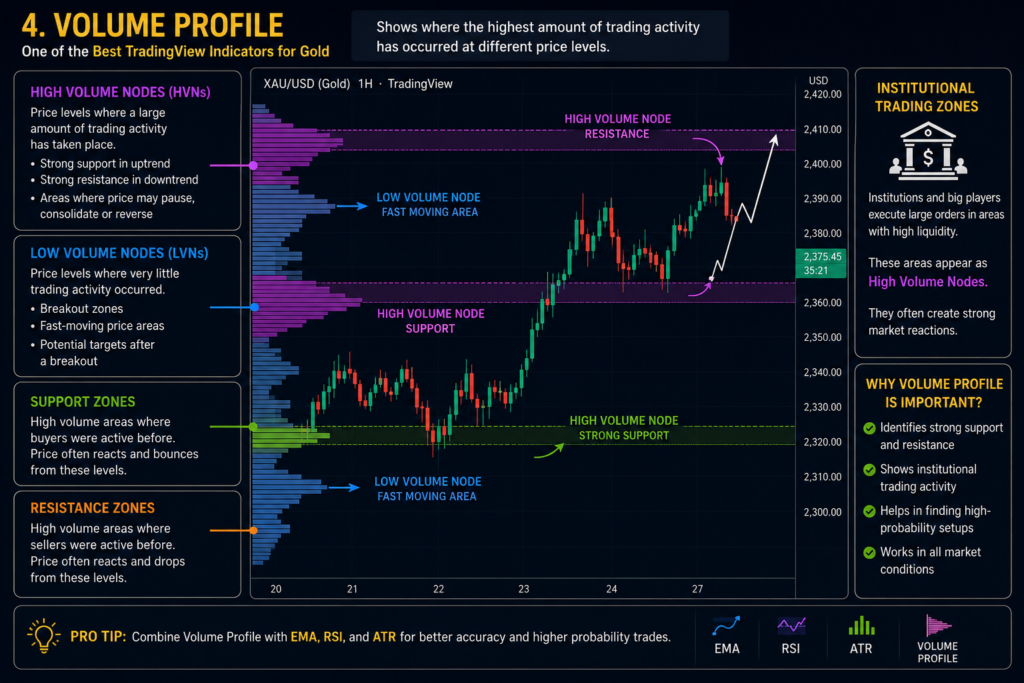
The Volume Profile is one of the Best TradingView Indicators for Gold because it shows where the highest amount of trading activity has occurred at different price levels. Unlike traditional volume indicators that display trading volume over time, the Volume Profile displays volume by price, helping traders identify the levels where buyers and sellers have been most active.
Professional and institutional traders often use the Volume Profile to find important support and resistance zones, making it one of the Best TradingView Indicators for Gold for understanding market structure and identifying high-probability trading opportunities.
High Volume Nodes (HVNs)
High Volume Nodes (HVNs) are price levels where a large amount of trading activity has taken place. These areas indicate that buyers and sellers strongly agreed on the value of gold, resulting in heavy trading volume.
High Volume Nodes often act as:
- Strong support during an uptrend.
- Strong resistance during a downtrend.
- Areas where the market may pause, consolidate, or reverse.
When the gold price returns to a High Volume Node, traders closely watch for a reaction because these levels often attract significant buying or selling interest.
Low Volume Nodes (LVNs)
Low Volume Nodes (LVNs) represent price levels where very little trading activity occurred. Since the market spent little time at these prices, gold often moves through these areas quickly.
Low Volume Nodes commonly act as:
- Breakout zones.
- Fast-moving price areas.
- Potential targets after a breakout.
When gold enters a Low Volume Node, price often accelerates because there is less historical trading activity to slow the move.
Identifying Strong Support
One of the biggest advantages of the Volume Profile is its ability to identify strong support levels. Instead of relying only on historical price lows, traders can see where large amounts of buying activity previously occurred.
If gold retraces toward a High Volume Node and buyers begin defending that level again, it can become an excellent area for potential buy setups. This is one reason why the Volume Profile is considered one of the Best TradingView Indicators for Gold.
Finding Reliable Resistance
The Volume Profile also highlights areas where heavy selling previously entered the market. When gold approaches these High Volume Nodes from below, sellers may become active again, causing price to stall or reverse.
Combining these resistance zones with candlestick confirmation or trend indicators can significantly improve trade accuracy.
Identifying Institutional Trading Zones
Large financial institutions, hedge funds, and banks typically execute orders in areas with high liquidity rather than chasing fast-moving prices. These institutional trading zones often appear as High Volume Nodes on the Volume Profile.
Because institutional participants control substantial trading volume, their buying and selling activity can create important market turning points. By identifying these zones, retail traders can better understand where significant market reactions are likely to occur.
Many professional traders combine institutional trading zones with trend analysis and price action to improve the probability of successful trades.
Pro Tip for Using Volume Profile
The Volume Profile does not generate buy or sell signals on its own. Instead, it identifies the most important price levels where market participants have previously shown strong interest.
For the best results, combine the Best TradingView Indicators for Gold by using:
- EMA (20, 50, and 200) to identify the trend.
- RSI (14) to confirm momentum.
- ATR (14) to measure market volatility.
- Volume Profile to locate key support, resistance, and institutional trading zones.
Using these indicators together provides a complete trading strategy, helping you identify stronger entry points, manage risk effectively, and trade gold with greater confidence.
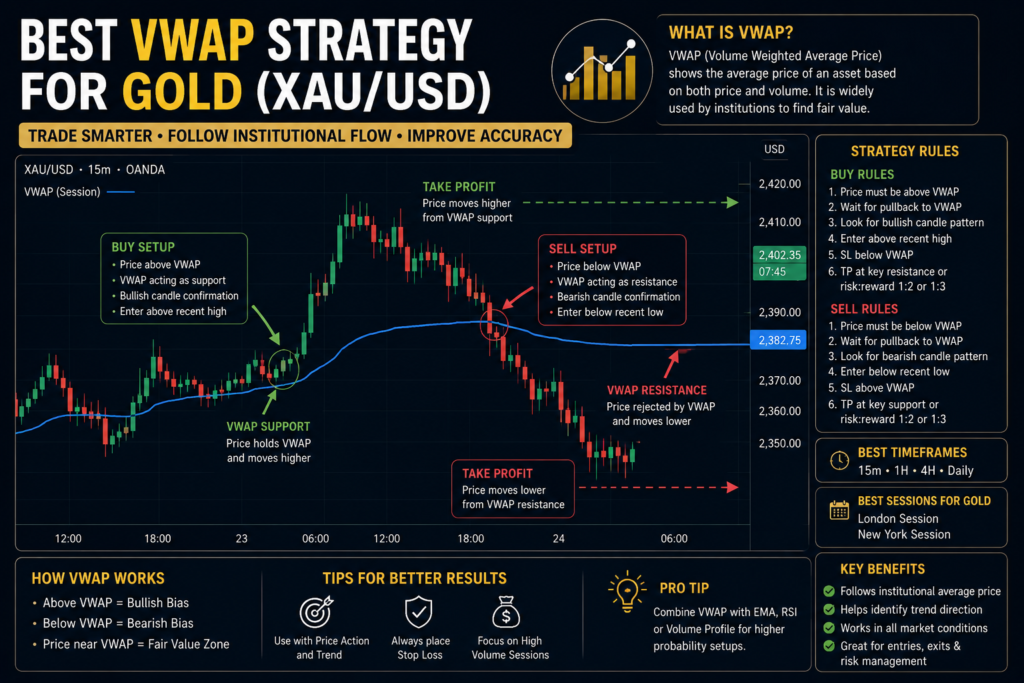
5. VWAP (Volume Weighted Average Price)
(VWAP) is one of the most valuable tools for intraday traders. Unlike a simple moving average, VWAP calculates the average price of Gold based on both price and trading volume. This gives traders a better understanding of where the majority of market participants have traded throughout the day. Many professional traders and institutions rely on VWAP to identify fair value, making it an essential part of the Best TradingView Indicators for Gold.
Intraday Trading
VWAP is designed specifically for intraday trading and resets at the beginning of each trading session. Gold traders use it to determine whether the current price is trading above or below the average market price for the day. When the price remains above VWAP, it often indicates bullish momentum, while trading below VWAP suggests bearish sentiment. This makes VWAP one of the Best TradingView Indicators for Gold for day traders looking to follow the market trend.
Mean Reversion
VWAP is also widely used for mean reversion strategies. After a strong price move, Gold often pulls back toward the VWAP before continuing its trend or reversing direction. Traders use these pullbacks as potential entry opportunities, especially when combined with support and resistance levels or candlestick confirmation. This ability to identify high-probability retracement zones is another reason VWAP ranks among the Best TradingView Indicators for Gold.
Trend Confirmation
VWAP acts as a dynamic support and resistance level throughout the trading session. If Gold consistently trades above VWAP, buyers are generally in control, confirming an uptrend. Conversely, if the price stays below VWAP, sellers dominate the market, confirming a downtrend. Combining VWAP with indicators such as the 20 EMA or RSI can significantly improve trade accuracy and reduce false signals.
Institutional Benchmark
Large financial institutions, hedge funds, and professional traders often use VWAP as a benchmark to evaluate the quality of their trade executions. Buying below VWAP or selling above VWAP is generally considered favorable because it indicates execution at a better-than-average market price. Since institutional activity heavily influences Gold prices, understanding VWAP can help retail traders align their trades with the broader market. This is why experienced traders consistently include VWAP in their list of the Best TradingView Indicators for Gold.
Best VWAP Strategy for Gold
For the best results, use VWAP alongside price action and trend-following indicators rather than relying on it alone. A simple setup is to use the 20 EMA to identify the overall trend, VWAP to confirm the market direction, and RSI (14) to avoid entering overbought or oversold conditions. This combination creates a balanced trading strategy that works well for intraday Gold trading and helps traders make more informed decisions.
6. MACD (Moving Average Convergence Divergence)
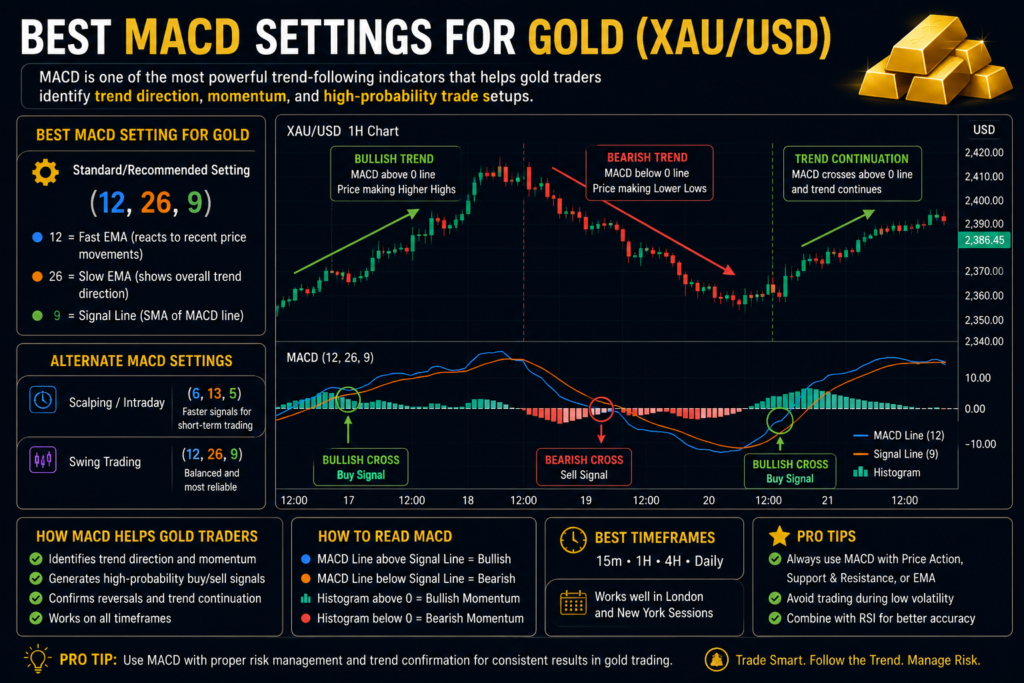
The Moving Average Convergence Divergence (MACD) is one of the Best TradingView Indicators for Gold because it helps traders identify trend direction, momentum, and potential entry or exit points. MACD compares two exponential moving averages (EMAs) to show whether bullish or bearish momentum is strengthening or weakening. Whether you are a day trader or swing trader, MACD can provide valuable confirmation before entering a Gold (XAU/USD) trade.
Trend Strength
One of the biggest advantages of MACD is its ability to measure trend strength. When the MACD line stays above the signal line and both lines are above the zero line, it indicates a strong bullish trend. On the other hand, when the MACD line remains below the signal line and under the zero line, it confirms a strong bearish trend. This makes MACD one of the Best TradingView Indicators for Gold for identifying the overall market direction and avoiding trades against the prevailing trend.
Momentum Shifts
MACD is also excellent for spotting changes in market momentum before they become obvious on the price chart. As the distance between the MACD line and the signal line changes, traders can identify whether buying or selling pressure is increasing or decreasing. A weakening bullish momentum may signal an upcoming pullback, while strengthening bullish momentum often supports trend continuation. Recognizing these momentum shifts allows traders to prepare for potential reversals or breakout opportunities.
Crossovers
The MACD crossover is one of the most widely used trading signals. A bullish crossover occurs when the MACD line crosses above the signal line, suggesting that buyers are gaining control and a potential upward move may begin. A bearish crossover happens when the MACD line crosses below the signal line, indicating increasing selling pressure. Although crossovers can generate effective entry signals, they are more reliable when confirmed by price action, support and resistance levels, or other tools such as the 20 EMA or RSI.
Histogram
The MACD histogram provides a visual representation of the difference between the MACD line and the signal line. Growing histogram bars indicate increasing momentum, while shrinking bars suggest that the current trend is losing strength. For Gold traders, the histogram can act as an early warning signal before a crossover occurs, helping them anticipate possible market reversals or trend continuations. This feature makes MACD one of the Best TradingView Indicators for Gold for monitoring market momentum in real time.
Best MACD Settings for Gold
The default MACD settings (12, 26, 9) work well for most Gold traders and provide reliable signals across multiple timeframes. For the best results, combine MACD with trend-following indicators like the 20 EMA and 50 EMA, and use price action to confirm entries. By using MACD as part of a complete trading strategy instead of relying on it alone, traders can improve the accuracy of their Gold trading decisions and reduce false signals.
7. Bollinger Bands
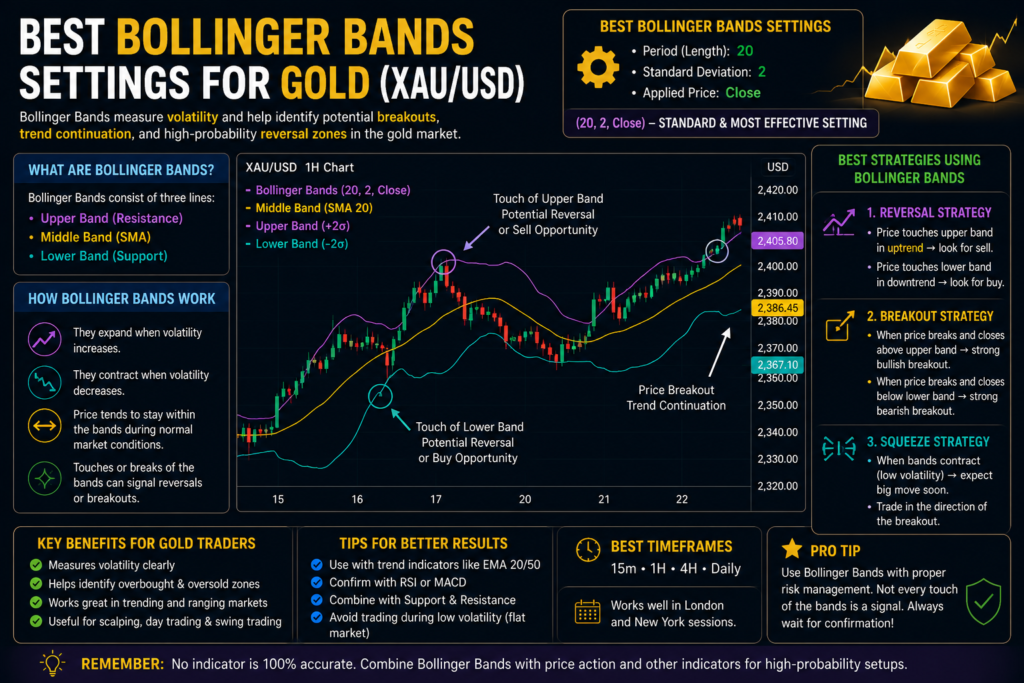
Among the Best TradingView Indicators for Gold, Bollinger Bands are widely used to measure market volatility, identify breakout opportunities, and spot potential price reversals. Developed by John Bollinger, this indicator consists of three lines: a middle moving average and two outer bands that expand and contract based on market volatility. Since Gold (XAU/USD) often experiences strong price swings, Bollinger Bands help traders understand when the market is calm and when a major move may be about to occur.
Volatility
One of the primary purposes of Bollinger Bands is to measure market volatility. When the bands widen, it indicates that Gold is experiencing high volatility, often during major news events or strong trending markets. When the bands contract, volatility decreases, suggesting that the market is consolidating. This ability to track changing market conditions makes Bollinger Bands one of the Best TradingView Indicators for Gold for both beginner and experienced traders.
Breakouts
Bollinger Bands are highly effective for identifying breakout opportunities. When Gold breaks above the upper band with strong buying momentum, it may signal the beginning of a bullish breakout. Likewise, a strong move below the lower band can indicate the start of a bearish breakout. However, traders should avoid entering trades based solely on a band breakout. Confirming the move with higher trading volume, candlestick patterns, or indicators such as RSI or MACD can help reduce false breakout signals.
Reversals
Bollinger Bands can also help identify potential market reversals. If Gold reaches the upper band after a strong rally and begins to show bearish candlestick patterns, the price may reverse lower. Similarly, when Gold touches the lower band after a sharp decline and forms bullish reversal candles, buyers may step in and push the market higher. These reversal signals become more reliable when they align with key support and resistance levels or momentum indicators.
Squeeze Strategy
The Bollinger Band Squeeze is one of the most popular trading strategies for Gold. A squeeze occurs when the upper and lower bands move very close together, indicating extremely low volatility. This period of consolidation often precedes a significant price breakout. Traders monitor the squeeze closely because Gold frequently makes powerful moves once volatility returns. By waiting for a confirmed breakout after the squeeze, traders can capture strong trends while avoiding many false signals.
Best Bollinger Bands Settings for Gold
The standard Bollinger Bands settings of 20-period Moving Average with 2 Standard Deviations work well for most Gold traders. For better accuracy, combine Bollinger Bands with the 20 EMA, RSI (14), and price action analysis. Using multiple confirmations rather than relying on Bollinger Bands alone can improve trade quality and make them one of the Best TradingView Indicators for Gold for identifying high-probability trading opportunities.