Table of Contents
Toggle1. Understanding XAUUSD Price Action
XAUUSD price action is simply the study of how gold moves against the US dollar by looking at the price itself. Instead of depending entirely on indicators, traders study candles, highs, lows, support, resistance, momentum, and reactions around important levels.
For gold traders, this approach can be particularly useful because XAUUSD can move quickly when liquidity enters the market. A candle that looks ordinary during a quiet session can become very important when it appears around a major level or during London or New York trading hours.
The goal isn’t to predict every candle. That’s not realistic. Instead, the objective is to understand what buyers and sellers are doing and wait for a situation where the price action gives you enough evidence to consider a trade.
What Does Price Action Tell You?
Price action can help answer several important questions:
- Is the market trending or ranging?
- Are buyers or sellers currently stronger?
- Where are traders likely placing stop-loss orders?
- Is price rejecting an important level?
- Is momentum increasing or decreasing?
- Has the market broken its previous structure?
- Is a potential entry developing?
These questions are more useful than simply asking whether gold is going up or down.
Why Gold Needs a Different Approach
Gold can produce sharp movements within a few minutes. News, US economic data, changes in the dollar, bond yields, and market sentiment can all influence XAUUSD.
Because of this volatility, entering simply because a candle looks bullish can be dangerous. Context matters.
For example, imagine XAUUSD has been moving upward and reaches a previous resistance area. A large bullish candle appears, but the next candle immediately rejects that high and closes bearish.
That reaction tells you more than the first bullish candle by itself. It suggests that sellers are willing to defend that area.
This is why I prefer to look at the story behind the candles, rather than treating every candle as an isolated signal.
The 5-Minute Chart Is Not a Complete Trading System
One mistake beginners make is believing that a timeframe itself creates a strategy.
It doesn’t.
The 5-minute chart is simply where you observe price. Your actual decision should come from a combination of market structure, important levels, liquidity, momentum, and confirmation.
For example:
Higher timeframe trend → important level → liquidity sweep → strong reaction → 5-minute entry
This sequence provides much more context than simply saying, “The 5-minute candle is bullish.”
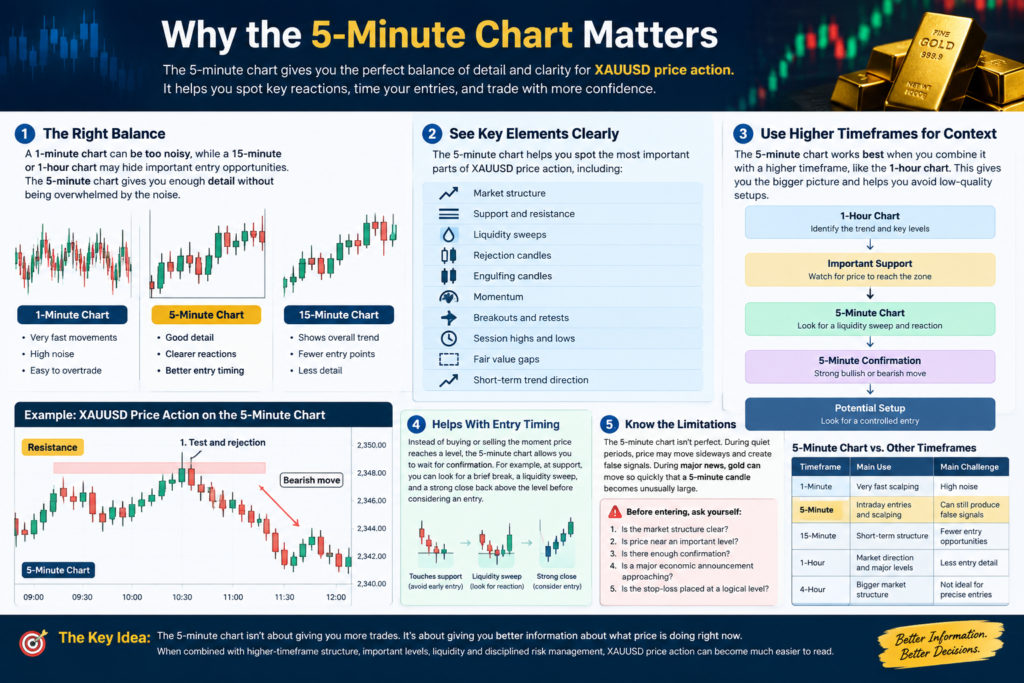
Why the 5-Minute Chart Matters
The 5-minute chart is one of the most useful timeframes for short-term gold traders because it provides enough detail to study individual price movements without becoming overwhelmed by the noise of very small timeframes. When using XAUUSD price action, this timeframe can help you see how buyers and sellers react around important levels.
A 1-minute chart can move extremely fast, making it easy to enter trades based on random fluctuations. On the other hand, a 15-minute or 1-hour chart may provide excellent overall context but doesn’t always show the smaller price reactions needed for a precise intraday entry.
A Good Balance Between Detail and Noise
The main advantage of the 5-minute chart is balance. Each candle represents five minutes of trading activity, so you can clearly observe momentum, rejection, breakouts, pullbacks, and changes in short-term market structure.
For XAUUSD price action, this balance is especially useful because gold can make relatively large moves within a short period. You can watch how price develops instead of reacting to every tiny movement.
For example, imagine gold approaches a resistance level. On the 1-minute chart, you might see several bullish and bearish candles forming within seconds, which can make the situation look confusing.
On the 5-minute chart, however, the same movement may appear much clearer. You might see price test resistance, create a long upper wick, and then close below the level. That gives you a better picture of the overall reaction.
Why the 5-Minute Chart Works Well for Gold
Gold is known for its volatility, particularly during active trading sessions. This creates opportunities for short-term traders, but it also means that poor entries can move against you quickly.
The 5-minute timeframe allows you to observe several important elements together:
- Market structure
- Support and resistance
- Liquidity sweeps
- Rejection candles
- Engulfing candles
- Momentum
- Breakouts and retests
- Session highs and lows
- Fair value gaps
- Short-term trend direction
Instead of relying on one signal, you can combine these elements to develop a clearer trading idea.
Use Higher Timeframes for Context
Although the 5-minute chart is useful for entries, it shouldn’t be viewed in isolation.
A higher timeframe such as the 1-hour chart can help you understand the bigger picture. You can identify whether gold is generally trending upward, trending downward, or moving sideways before moving to the 5-minute timeframe.
For example:
1-Hour Chart: Bullish trend
↓
Important Support: Price approaches the zone
↓
5-Minute Chart: Liquidity sweep
↓
5-Minute Confirmation: Strong bullish reaction
↓
Potential Setup: Look for a controlled entry
This approach makes XAUUSD price action more structured because the 5-minute chart becomes your execution timeframe rather than your only source of information.
The 5-Minute Chart Helps With Entry Timing
One of the biggest benefits of this timeframe is entry timing.
Suppose gold reaches an important support area. You don’t necessarily want to buy the moment price touches the level. Instead, you can wait for evidence that buyers are actually defending it.
You might see price briefly break below support, take liquidity, and then close strongly back above the level. A later pullback could provide a more controlled entry than buying the initial move.
This is where XAUUSD price action becomes particularly useful. You’re not simply predicting what gold will do. You’re waiting for the market to show you a reaction and then evaluating whether that reaction fits your trading plan.
When the 5-Minute Chart Can Be Difficult
The timeframe isn’t perfect.
During extremely quiet periods, price may move sideways and create many false signals. During major economic announcements, the opposite can happen. Gold may move so quickly that a 5-minute candle becomes unusually large.
For this reason, don’t assume that more volatility automatically means a better trading opportunity.
Before entering, consider:
- Is the market structure clear?
- Is price near an important level?
- Is there enough confirmation?
- Is a major economic announcement approaching?
- Is the stop-loss placed at a logical invalidation point?
5-Minute Chart vs. Other Timeframes
| Timeframe | Main Use | Main Challenge |
|---|---|---|
| 1-Minute | Very fast scalping | High noise |
| 5-Minute | Intraday entries and scalping | Can still produce false signals |
| 15-Minute | Short-term structure | Fewer entry opportunities |
| 1-Hour | Market direction and major levels | Less entry detail |
| 4-Hour | Bigger market structure | Not ideal for precise entries |
Start With the Market Structure
Before looking for an entry on the 5-minute chart, start by understanding the overall market structure. XAUUSD price action becomes much easier to read when you first determine whether gold is trending upward, trending downward, or moving sideways.
Market structure is essentially the sequence of highs and lows created by price. Instead of trying to predict the next candle, you’re studying what the market has already shown you and using that information to build a more logical trading plan.
Identify Higher Highs and Higher Lows
A bullish market typically creates a series of higher highs and higher lows.
For example:
Higher High → Higher Low → Higher High → Higher Low
This structure suggests that buyers are generally maintaining control. When you see this pattern on a higher timeframe, you can use the 5-minute chart to look for buying opportunities around meaningful support areas rather than randomly entering in the middle of a move.
Understand Lower Highs and Lower Lows
A bearish structure is usually the opposite.
Lower Low → Lower High → Lower Low → Lower High
This shows that sellers are pushing the market lower and preventing buyers from creating new highs.
When this happens, you can focus more on potential short setups, especially when price retraces toward resistance or a previous swing area.
Don’t Ignore a Sideways Market
Not every XAUUSD session produces a clean trend. Sometimes price moves between a relatively defined high and low, creating a range.
In a ranging market, you’ll often see price repeatedly move toward resistance and then fall back toward support. Trying to trade every small movement inside this range can lead to overtrading, so it’s important to recognize when the market lacks a clear direction.
Use the Higher Timeframe First
One of the most useful habits when studying XAUUSD price action is to start with a higher timeframe before moving to the 5-minute chart.
You might use the 1-hour chart to identify:
- Overall trend direction
- Major swing highs
- Major swing lows
- Important support
- Important resistance
- Large areas of consolidation
Then move down to the 5-minute chart for a more precise view.
For example, if the 1-hour chart is bullish and gold pulls back toward a strong support area, the 5-minute chart can help you determine whether buyers are beginning to step back into the market.
Watch for a Change in Structure
Market structure isn’t permanent.
Suppose XAUUSD has been creating higher highs and higher lows. Eventually, price falls through an important previous higher low with strong momentum.
That doesn’t automatically mean you should open a short position. However, it tells you that the previous bullish structure may be weakening.
You can then wait for additional confirmation, such as:
- A bearish rejection
- A lower high
- A strong bearish candle
- A liquidity sweep
- A break and retest
- Strong bearish displacement
This is a much more disciplined approach than immediately entering a trade after seeing one bearish candle.
Structure Breaks Can Provide Important Clues
A structure break becomes more meaningful when it occurs around an important level.
Imagine gold is trading upward and reaches a major resistance zone. Price pushes above the previous high but fails to hold there. It then falls below a nearby 5-minute swing low.
Now you have several pieces of information:
Resistance → Liquidity sweep → Rejection → Structure break
That sequence gives you a stronger reason to pay attention than a simple red candle appearing randomly on the chart.
This is where XAUUSD price action becomes about reading the complete story rather than looking for isolated patterns.
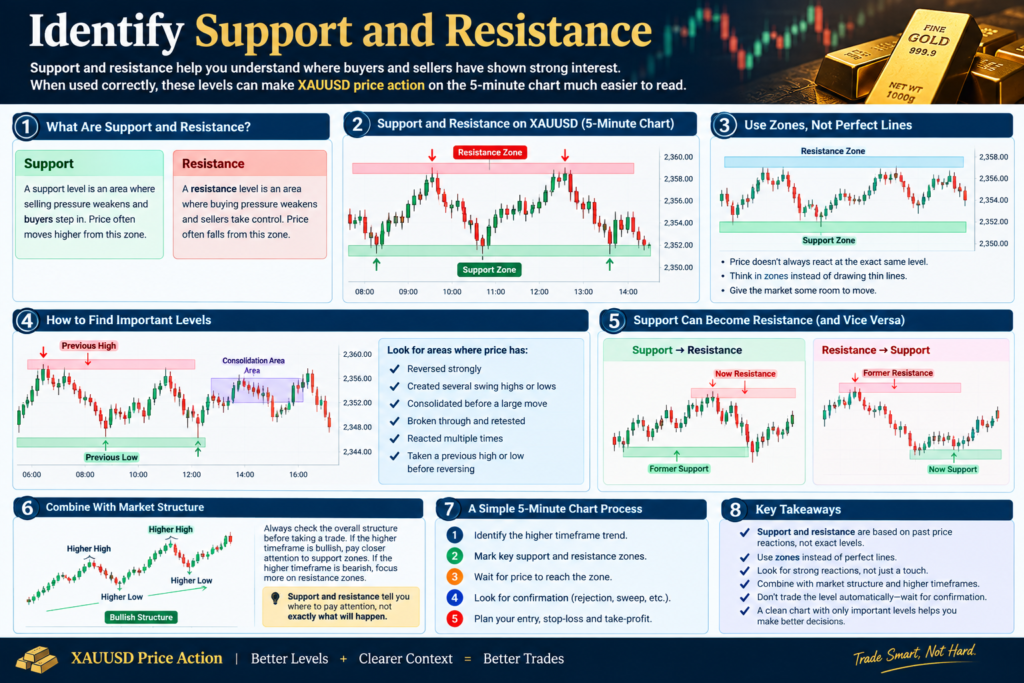
Identify Support and Resistance
Identifying support and resistance is an important part of reading XAUUSD price action on the 5-minute chart. These areas help you understand where buyers and sellers have previously shown strong interest, giving you useful reference points before looking for a potential entry.
What Is Support?
Support is an area where selling pressure has previously weakened and buyers have stepped in. When gold approaches this area again, traders watch closely to see whether buyers react in a similar way.
For example, if XAUUSD falls toward a previous low several times and repeatedly moves higher from that area, the zone may be considered support. However, support isn’t a guaranteed floor because price can eventually break through it.
What Is Resistance?
Resistance is the opposite. It’s an area where buyers have previously struggled to push price higher and sellers have entered the market.
If gold repeatedly reaches a certain area and then falls, that area can become an important resistance zone. When using XAUUSD price action, the reaction around resistance is often more important than the exact price level itself.
Look for Zones, Not Perfect Lines
One common beginner mistake is drawing support and resistance as extremely precise lines.
Markets don’t always reverse at the exact same price. Gold may move slightly above or below a previous level before reversing, especially when liquidity is present.
For this reason, it’s often better to think in terms of zones.
For example:
- Previous swing low = potential support zone
- Previous swing high = potential resistance zone
- Session high = important reference area
- Session low = important reference area
- Consolidation area = possible future reaction zone
This approach gives price enough room to move naturally.
How to Find Important Levels
Start by looking at the higher timeframe before moving to the 5-minute chart. The 1-hour chart can help you identify major swing points and areas where gold previously made strong moves.
Then move to the 5-minute chart and mark the levels that are closest to the current price.
Look for areas where price has:
- Reversed strongly
- Created several swing highs or lows
- Consolidated before a large move
- Broken through and later retested
- Reacted multiple times
- Taken a previous high or low before reversing
These areas can become important when analyzing XAUUSD price action.
Previous Highs and Lows Matter
Previous highs and lows are simple but useful reference points.
Suppose gold created a strong high during the London session and later returned to that area during New York trading. You can watch how price behaves when it reaches the previous high.
Three things could happen:
- Price rejects the level.
- Price breaks above and continues higher.
- Price moves above the high and then falls back below it.
The third situation can be particularly interesting because it may represent a liquidity sweep or failed breakout.
Don’t Trade the Level Automatically
A support or resistance zone isn’t an automatic buy or sell signal.
This is one of the most important ideas to understand.
If gold reaches support, don’t immediately buy. Instead, watch what price does at the zone.
You might see:
Support → Liquidity sweep → Rejection → Bullish candle → Minor structure break
That sequence provides more information than simply seeing price touch support.
Likewise, at resistance, you might wait for:
Resistance → Break above → Rejection → Bearish displacement → Structure shift
This allows XAUUSD price action to provide confirmation before you consider an entry.
Support Can Become Resistance
A broken support level can sometimes become resistance later.
Imagine gold is trading above a support zone. Price eventually breaks below it with strong momentum and continues lower.
Later, gold pulls back toward the same area from underneath.
Instead of acting as support, the old level may now behave as resistance.
This is often called a role reversal.
The same concept can work in the opposite direction when resistance is broken and later becomes support.
Read Candlestick Reactions
Candlesticks are one of the simplest ways to understand what buyers and sellers are doing on the 5-minute gold chart. Instead of treating every candle as a trading signal, focus on where the candle forms, how it closes, and what happens immediately afterward. This approach makes XAUUSD price action easier to understand and helps you avoid entering trades based on a single candle.
Understand What Each Candle Shows
Every 5-minute candle shows four basic prices:
- Open: Where the candle started
- High: The highest price reached
- Low: The lowest price reached
- Close: Where the candle finished
The relationship between these prices gives you clues about buying and selling pressure.
For example, a candle that moves strongly upward and closes near its high suggests that buyers maintained control during that period. On the other hand, a candle with a long upper wick and a weak close may show that sellers pushed price back down.
When studying XAUUSD price action, the closing position of a candle can often be more useful than simply looking at whether the candle is green or red.
Look for Rejection Candles
A rejection candle occurs when price moves into an area but fails to remain there.
Imagine gold approaches a resistance zone and briefly moves higher. Sellers then enter, pushing the price back down before the 5-minute candle closes.
The result may be a candle with a long upper wick.
This tells you that higher prices were rejected.
The same idea works around support. If gold moves below support but buyers quickly push it back upward, the candle may leave a long lower wick.
However, don’t enter simply because you see a wick. A rejection becomes more meaningful when it appears at an important support or resistance area.
Pay Attention to Engulfing Candles
Engulfing candles can provide another useful clue about momentum.
A bullish engulfing candle occurs when a strong bullish candle overtakes the body of the previous bearish candle. A bearish engulfing candle occurs when a strong bearish candle overtakes the previous bullish candle.
For example, suppose XAUUSD reaches a support zone after a decline. A small bearish candle forms, followed by a strong bullish candle that engulfs the previous candle.
That reaction suggests that buying pressure has increased.
Still, an engulfing candle in the middle of a random range doesn’t carry the same significance as one forming at a major level.
Study the Candle Close
One of the easiest ways to improve your XAUUSD price action analysis is to pay more attention to candle closes.
Consider two bullish candles:
Candle A:
Large bullish body → closes near the high
Candle B:
Large bullish move → long upper wick → closes near the middle
Although both candles moved upward, they tell different stories.
Candle A suggests buyers maintained stronger control into the close. Candle B shows that sellers managed to push price back from the highs.
This doesn’t predict the next candle, but it gives you useful information about the current battle between buyers and sellers.
Watch for Liquidity Sweeps
Liquidity sweeps are an important part of reading XAUUSD price action, especially on the 5-minute chart. Gold often moves quickly through obvious highs or lows before reversing, which can trap traders who enter too early.
A liquidity sweep happens when price briefly moves above a previous high or below a previous low, triggers stop-loss orders, and then returns back inside the previous range. Instead of treating every breakout as a real continuation, I look at how price reacts after taking that liquidity.
What Is a Liquidity Sweep?
Imagine XAUUSD forms a clear high around $2,650 several times. Many traders may place their stop-losses just above this level, while breakout traders may place buy orders above it.
Price suddenly moves to $2,653, triggers those orders, and then quickly falls back below $2,650. This can be a liquidity sweep because the market has taken the liquidity sitting above the obvious high before showing rejection.
The same idea applies to lows. If price briefly breaks below a well-defined support level and then quickly moves back above it, traders may consider this a sell-side liquidity sweep.
How to Spot a Liquidity Sweep on the 5-Minute Chart
When analyzing XAUUSD price action, focus on obvious areas where many traders could have placed stops. Previous swing highs, swing lows, equal highs, equal lows, and major session levels are common areas to watch.
Look for three basic steps:
- Price approaches an obvious high or low.
- Price briefly breaks that level.
- Price rejects the breakout and closes back inside the previous area.
The third step is especially important. A simple break of a level does not automatically mean a liquidity sweep.
Buy-Side and Sell-Side Liquidity
Buy-side liquidity is commonly found above previous highs. If price moves above those highs and then rejects the area, it may create a potential short-term reversal setup.
Sell-side liquidity is commonly found below previous lows. When price pushes below a low and then quickly recovers, it may create a potential bullish reaction.
For example, suppose XAUUSD forms equal lows near $2,640. Price drops to $2,637, creates a long lower wick, and then closes back above $2,640. That reaction can provide useful information about XAUUSD price action, but it should still be confirmed with market structure or momentum.
Do Not Trade Every Sweep
One of the biggest mistakes is assuming every wick above a high or below a low is a trade signal. Sometimes the market genuinely breaks the level and continues in the same direction.
I therefore look for confirmation after the sweep. A strong rejection candle, displacement, break of short-term structure, or a return into a meaningful support or resistance zone can provide additional context.
This helps separate a potential liquidity grab from a normal breakout. It also keeps XAUUSD price action analysis focused on the reaction rather than the sweep alone.
Conclusion
Reading XAUUSD price action on the 5-minute chart becomes much easier when you focus on the overall story instead of trying to predict every candle. Start with market structure, mark important support and resistance levels, and then study how price reacts around those areas.
Liquidity sweeps, rejection candles, momentum, and trading-session levels can provide additional confirmation before an entry. No single signal is guaranteed, so the goal is to combine several pieces of evidence and avoid weak setups.
With practice, XAUUSD price action can help you understand why gold is moving and where a potential setup is developing. Keep your analysis simple, wait for confirmation, manage risk carefully, and let the price action guide your decisions rather than forcing a trade.