Table of Contents
ToggleWhat Are Support and Resistance?
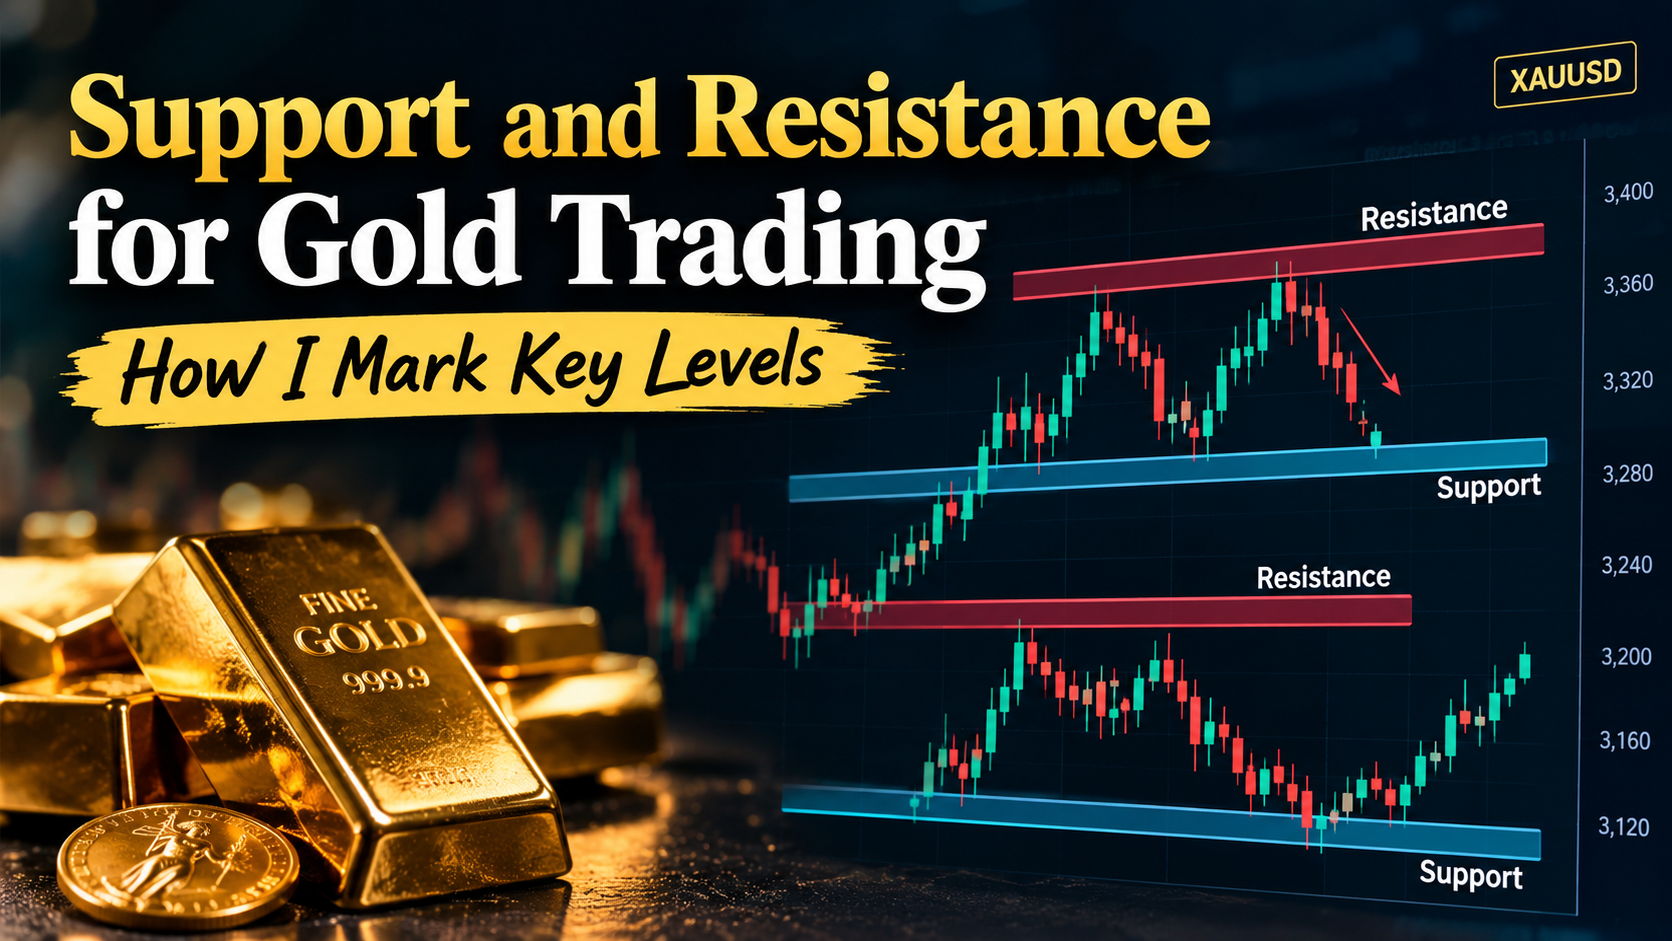
Support and resistance for gold trading are important price areas where gold (XAUUSD) has previously shown strong buying or selling pressure. Support is an area where falling prices may find buyers, while resistance is an area where rising prices may face selling pressure.
For example, if gold repeatedly falls toward a certain price and then moves higher, that area can become a support zone. Similarly, if gold repeatedly reaches a price level but struggles to move above it, that area may act as resistance. These reactions make support and resistance for gold trading useful for identifying potential turning points.
n analyzing support and resistance for gold trading, traders can also combine these areas with market structure, previous highs and lows, liquidity, trend direction, and candlestick patterns. This approach can provide better context than using support or resistance alone.
Understanding support and resistance for gold trading can help organize an XAUUSD chart and identify areas where price may react. However, these levels are not guaranteed entry signals, so proper confirmation and risk management remain
How I Mark Support and Resistance on Gold
When trading gold, I focus on identifying areas where price has previously reacted strongly. support and resistance for gold trading helps me understand where buyers or sellers may become active and where price could potentially reverse, consolidate, or break out.
1. Start With Higher Timeframes
I first check the Daily and 4-hour charts to identify major price levels. These timeframes help filter out market noise and show stronger areas where gold has repeatedly reacted.
2. Mark Previous Highs and Lows
Previous swing highs and lows are some of the most useful levels. If gold has repeatedly struggled to move above a certain area, I mark it as potential resistance. Similarly, repeated reactions from a lower area can indicate potential support.
3. Look for Multiple Price Reactions
I give more attention to levels that have been tested several times. A level with multiple strong reactions can provide useful information when analyzing support and resistance for gold trading, especially when it aligns with other technical factors.
4. Use Zones Instead of Exact Lines
Gold can move quickly and often reacts within a small price range rather than at one exact number. Instead of drawing a single thin line, I usually mark a support or resistance zone around the area where several candles reacted.
5. Check Liquidity and Market Structure
I also look for liquidity around previous highs and lows. A quick move above resistance followed by a rejection, for example, can indicate a liquidity sweep. Combining market structure with support and resistance for gold trading can provide better context than relying on levels alone.
6. Confirm on Lower Timeframes
After marking important levels on the Daily or 4-hour chart, I move to the 1-hour, 30-minute, or 15-minute chart for confirmation. I look for price rejection, break-and-retest patterns, or changes in market structure before considering a trade.
Start With the Daily Chart
When analyzing s
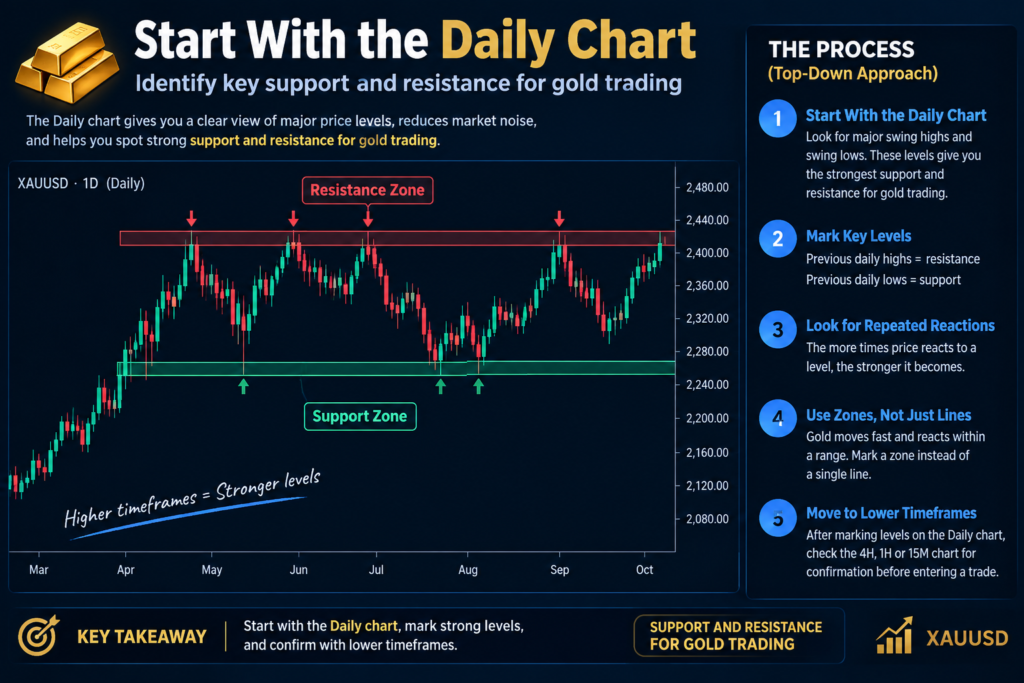
upport and resistance for gold trading, I start with the Daily chart to identify the most important price areas. The Daily timeframe reduces market noise and helps me see major swing highs, swing lows, and zones where XAU/USD has reacted strongly.
I mark previous daily highs as potential resistance and previous daily lows as potential support. I also pay attention to areas where gold has tested the same price several times because repeated reactions can make these zones more relevant.
After marking the major levels on the Daily chart, I move to lower timeframes such as the 4-hour, 1-hour, or 15-minute chart to look for confirmation before making a trading decision. This top-down approach makes support and resistance for gold trading more structured and easier to follow.
Mark Previous Highs and Lows
When analyzing support and resistance for gold trading, previous highs and lows are some of the most important areas to mark on the chart. These levels show where the market has previously changed direction, giving traders useful clues about where price may react again.
Previous Highs as Resistance
A previous swing high can become a potential resistance area. When gold reaches a previous high, sellers may enter the market or existing buyers may take profits. If price repeatedly fails to break above the same area, that zone becomes more significant.
For example, if XAU/USD reaches a similar price level several times and gets rejected each time, I would mark that area as a resistance zone. A strong breakout above the zone can then change the market structure and potentially turn the old resistance into support.
Previous Lows as Support
Previous swing lows can work in the opposite way. When gold falls back toward an area where buyers previously entered, that level may act as potential support.
I look for strong bullish reactions, long lower wicks, or multiple tests around the previous low. However, support is not guaranteed to hold. If sellers push price decisively below the zone, the market may continue lower.
Look for Multiple Reactions
One reaction can be useful, but multiple reactions can make a level more noticeable. When price repeatedly respects the same area, I give that zone more attention during my analysis.
This is especially useful for support and resistance for gold trading because gold can move quickly and often reacts around zones rather than exact prices.
Mark Zones Instead of Exact Lines
I avoid placing too many lines on the chart. Instead, I highlight a small price range around the previous high or low. This gives price some room to move without treating every small movement as a breakout or rejection.
Check Higher Timeframes First
I usually start by marking major highs and lows on the Daily and 4-hour charts. These levels can provide broader market context before I move to the 1-hour, 30-minute, or 15-minute chart for more detailed analysis.
Watch for Liquidity Sweeps
Previous highs and lows can also attract liquidity. Gold may briefly move above a previous high or below a previous low before reversing back into the range. This is often called a liquidity sweep or stop hunt.
For this reason, I don’t automatically treat every move beyond a previous level as a confirmed breakout. I wait for the candle close, market structure, and price reaction to provide additional confirmation.
Look for Multiple Price Reactions
When identifying support and resistance for gold trading, I pay close attention to areas where gold has reacted multiple times. If price repeatedly reaches the same area and reverses, it can indicate that buyers or sellers are actively defending that zone.
For example, if XAU/USD approaches a certain price three or four times but repeatedly fails to break above it, that area can be marked as a potential resistance zone. Likewise, repeated bullish reactions from a lower price area can indicate potential support.
Multiple reactions do not guarantee that a level will hold. Gold can eventually break through a well-tested zone, especially during strong market-moving events. Therefore, I combine repeated reactions with market structure, volume, liquidity, and higher-timeframe analysis before making a trading decision.
Using multiple reactions makes support and resistance for gold trading more reliable than simply marking random highs and lows. It also helps keep the chart cleaner by focusing on price areas that have demonstrated meaningful market reactions.
Understanding Support and Resistance Flips
A support and resistance flip happens when a previous support level becomes resistance or a previous resistance level becomes support. This concept is particularly useful when analyzing support and resistance for gold trading, because XAUUSD often retests important levels after a breakout.
For example, suppose gold has repeatedly found buyers around a $3,600 area. This zone acts as support. If gold eventually breaks below it with strong momentum and later returns to the same area, sellers may defend the zone. In this situation, the old support can become new resistance.
The opposite can happen when gold breaks above a resistance zone. If price moves higher and then returns to retest that area, buyers may defend it as new support. This is commonly called a support-to-resistance or resistance-to-support flip.
When using support and resistance for gold trading, I don’t consider every breakout a confirmed flip. I look for additional evidence such as a strong breakout candle, a successful retest, rejection from the level, or a change in market structure.
These flips can help traders understand how market sentiment is changing. However, gold can produce false breakouts, especially during major economic news, so traders should wait for confirmation rather than entering immediately after a level is broken.
The key idea is simple: when a significant level breaks, watch how price behaves when it comes back to that area. A successful retest can provide valuable information about whether the previous support or resistance has genuinely changed its role.
Support and Resistance + Liquidity Sweeps
One of the most useful concepts I watch after marking support and resistance for gold trading is the relationship between liquidity sweeps and support and resistance flips. A level does not always hold as support or resistance forever. When price breaks through an important level and later reacts from the opposite side, the old support can become resistance, or old resistance can become support.
What Is a Support and Resistance Flip?
A support and resistance flip happens when a previously important level changes its role.
For example, imagine gold has repeatedly found buyers around a support zone. Price eventually breaks below that zone, continues lower, and later returns to the same area. If sellers defend the area and price moves lower again, the former support has potentially flipped into resistance.
The opposite can happen when gold breaks above a resistance zone and later returns to test it. If buyers defend that area and price moves higher, the former resistance may have flipped into support.
How Liquidity Sweeps Fit Into the Flip
This becomes especially interesting when a liquidity sweep occurs around the level.
Suppose gold is trading below a well-known resistance area. Price suddenly pushes above the previous high, taking liquidity from traders who placed stops or breakout orders above that high. Instead of continuing upward, gold falls back below the resistance zone.
That failed move can provide important information. If price then shows bearish displacement and begins forming lower highs, I pay closer attention to the possibility that the resistance has held and the breakout was a liquidity sweep.
Example: Resistance Flips Into Support
Consider this simple sequence:
Resistance → Breakout → Price moves higher → Pullback → Retest → Buyers defend → Support
Gold first struggles to break above a resistance zone. Eventually, buyers push price through it, and the market establishes itself above the level.
When price later pulls back, I watch the old resistance area instead of immediately assuming the breakout has failed. If buyers step in and price reacts upward, the old resistance has potentially become new support.
This is one reason I prefer marking support and resistance for gold trading as zones rather than single lines.
Example: Support Flips Into Resistance
The opposite setup can happen during a bearish move:
Support → Breakdown → Price moves lower → Pullback → Retest → Sellers defend → Resistance
Suppose gold has repeatedly bounced from a support zone. Price eventually breaks below it with strong momentum and moves lower.
Later, gold returns to the same area from underneath. If sellers defend the zone and price starts falling again, I treat the old support as a potential resistance area.
What I Look for Before Considering the Flip
I do not consider every break and retest a valid flip. I want to see some evidence that the market has genuinely changed its relationship with the level.
I usually look for:
- A clear break of the original level
- Strong displacement away from the zone
- A return or retest of the area
- A rejection from the retest
- A liquidity sweep around nearby highs or lows
- A change in short-term market structure
- Confirmation from the higher timeframe
The more of these factors appear together, the more closely I watch the setup.
Support and Resistance + Fair Value Gaps
Another way I refine support and resistance for gold trading is by combining important price levels with Fair Value Gaps (FVGs). Instead of treating an FVG as an independent trading signal, I use it to understand what may happen when XAUUSD reaches a significant support or resistance zone.
This combination can help create a more structured analysis because the support or resistance tells me where to pay attention, while the Fair Value Gap can provide additional information about the price movement around that area.
What Is a Fair Value Gap?
A Fair Value Gap is an imbalance that can appear during a strong three-candle price movement. It represents an area where price moved quickly, leaving relatively little trading activity between certain candles.
For example, during a strong bullish move, the third candle may move significantly higher than the first candle’s range, creating a gap-like area between the candles. Traders often watch this zone to see whether price later returns to it.
The important point is that an FVG is not automatically a buy or sell signal.
How I Combine FVGs With Support
Suppose I have already marked a strong gold support zone on the 1-hour chart. Price then drops toward that area and creates a bullish displacement that leaves behind a bullish FVG.
Instead of buying immediately, I watch how price behaves when it returns toward the FVG and support zone.
A possible sequence could look like this:
Support → Liquidity sweep → Bullish displacement → Bullish FVG → Retest → Potential continuation
The support provides the location, while the displacement and FVG provide additional context.
How I Combine FVGs With Resistance
The same concept can work around resistance.
Imagine gold reaches a resistance zone and briefly pushes above a previous high. Price then quickly reverses and produces strong bearish displacement, leaving a bearish FVG behind.
I would then watch the FVG and resistance area during a potential retest.
The sequence might look like:
Resistance → Liquidity sweep → Bearish displacement → Bearish FVG → Retest → Potential continuation lower
Again, the FVG does not guarantee that price will fall. I want to see how the market reacts when it returns to the area.
Why the Combination Is Useful
When I use support and resistance for gold trading, I want my levels to have a clear reason behind them. Adding an FVG can give me another piece of information about the strength and speed of the move around that level.
For example, there is a difference between:
Gold touches resistance and slowly moves lower
and:
Gold sweeps a previous high, strongly rejects resistance, creates bearish displacement, and leaves an FVG.
The second situation gives me more price-action information to analyze.
Do Not Treat Every FVG as Important
This is where many traders can make their charts unnecessarily complicated.
If I mark every Fair Value Gap on a 5-minute XAUUSD chart, the screen can quickly become filled with zones. Most of them may have little relevance to the bigger market structure.
I prefer FVGs that appear around areas I have already identified as important, such as:
- Higher-timeframe support
- Higher-timeframe resistance
- Previous day high or low
- Major swing high or low
- Liquidity sweep
- Break of market structure
- Strong displacement
This keeps the analysis focused.
Example of My Gold Level-Marking Process
When I first started analyzing gold, I made the same mistake many beginners make: I marked almost every visible high and low on the chart. The result was a chart full of lines, and instead of making the analysis clearer, it made it harder to decide which levels actually mattered.
Over time, I found it more useful to keep my chart clean and build my analysis from the higher timeframe down. My approach to support and resistance for gold trading starts with finding the areas where price has already shown a meaningful reaction.
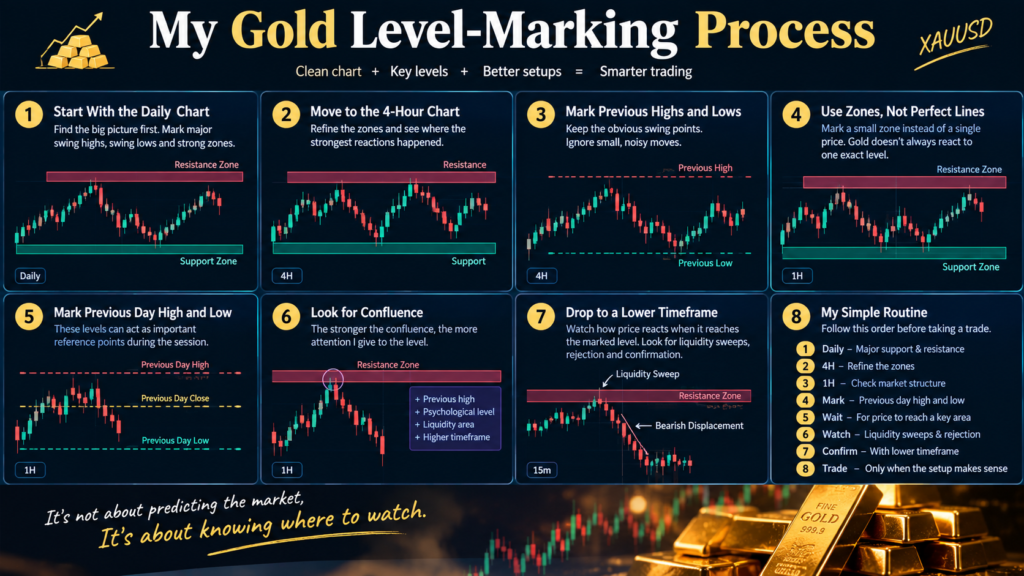
Step 1: I Start With the Daily Chart
I begin with the Daily chart because I want to see the bigger picture before focusing on an intraday setup.
I look for:
- Major swing highs
- Major swing lows
- Strong reversal areas
- Long consolidation zones
- Previous breakout areas
I do not mark every small movement. If a level is clearly visible without zooming in, it gets more attention from me.
Step 2: I Move to the 4-Hour Chart
After marking the major areas, I move to the 4-hour chart and refine them.
Sometimes a Daily level covers a fairly large price range. The 4H chart helps me understand where the strongest reactions occurred inside that range.
This is where support and resistance for gold trading starts becoming more practical for me because I can see whether the same area has been respected across multiple timeframes.
Step 3: I Mark the Previous Highs and Lows
Next, I mark important recent highs and lows.
For example, if gold created a strong high and then sold off aggressively, I keep that high on my chart as a potential resistance area. If gold made a strong low and then rallied, I mark that area as potential support.
I usually prefer obvious swing points over tiny highs and lows created by short-term noise.
Step 4: I Mark Zones, Not Perfect Lines
This was another thing I changed in my own chart analysis.
I used to draw a single horizontal line and expect gold to react exactly there. But gold does not always respect one exact price.
Now I usually mark a small zone around the area where the strongest reactions occurred. This gives me more flexibility when price moves slightly above or below the previous level.
Step 5: I Check the Previous Day’s High and Low
Before an intraday session, I also mark the previous day’s high and low.
These levels can become useful reference points when gold approaches them during London or New York trading.
For example, if price moves above the previous day’s high and then quickly falls back below it, I become interested in what that move means. I may then look for a liquidity sweep, rejection, or market-structure shift instead of immediately assuming it is a genuine breakout.
Step 6: I Look for Confluence
I do not want my entire analysis to depend on one horizontal line.
If a support zone also lines up with a previous swing low, a psychological price level, and a liquidity area, I pay closer attention to it.
The same applies to resistance.
This is how I make support and resistance for gold trading more selective instead of marking dozens of levels across the chart.
Step 7: I Drop to the 15-Minute or 5-Minute Chart
Once the important areas are marked, I move down to a lower timeframe when I am looking for an intraday setup.
This is where I watch the actual reaction.
For example:
Resistance → liquidity sweep → rejection → bearish displacement
or:
Support → liquidity sweep → bullish displacement → higher low
I am not looking for the exact same pattern every time. I mainly want to see whether price is actually reacting to the level I marked on the higher timeframe.
Final Thoughts
Learning support and resistance for gold trading is not about putting as many lines as possible on the XAUUSD chart. For me, the process is about identifying the areas that have a clear reason behind them and then waiting to see how price behaves when it reaches those zones.
I start with the higher timeframes, mark major swing highs and lows, and refine the important areas before moving to a lower timeframe. From there, I watch for liquidity sweeps, support and resistance flips, displacement, Fair Value Gaps, and changes in market structure.
The biggest lesson for me has been to stop treating every level as an immediate trade. A level gives me a location to watch, while price action tells me whether there is actually something worth analyzing.
With a clean chart and a consistent process, support and resistance for gold trading can become a much more practical part of an XAUUSD strategy.