Introduction to Forex Charts
When starting your trading journey, the very first skill you need to master is how to read forex charts. Forex charts are the backbone of trading because they visually represent how currency prices move over time. Without understanding charts, it becomes nearly impossible to make informed trading decisions.
In simple terms, forex charts act like a map. Just as a map helps you navigate roads, charts help you navigate the financial markets. If you truly want to succeed, learning how to read forex charts is not optional—it’s essential. These charts display price movements using different formats such as lines, bars, and candlesticks, allowing traders to analyze trends and predict future price behavior.
At first glance, charts may seem complicated. You’ll notice price fluctuations, patterns, and indicators that may feel overwhelming. However, once you begin to understand the basics, everything starts to make sense. That’s why beginners are strongly encouraged to focus on mastering how to read forex charts step by step instead of rushing into trading.
Forex charts provide critical information like:
- Price direction (up, down, or sideways)
- Market trends
- Entry and exit opportunities
- Key support and resistance levels
Moreover, understanding how to read forex charts helps you reduce emotional trading. Instead of guessing or relying on luck, you make decisions based on data and patterns. This improves your confidence and increases your chances of success.
Another important point is that charts are used by all types of traders—beginners, professionals, and institutions. This means when you learn how to read forex charts, you are essentially learning the universal language of the market. Everyone sees the same price action, which makes chart reading a powerful and reliable skill.
What Are Forex Charts?
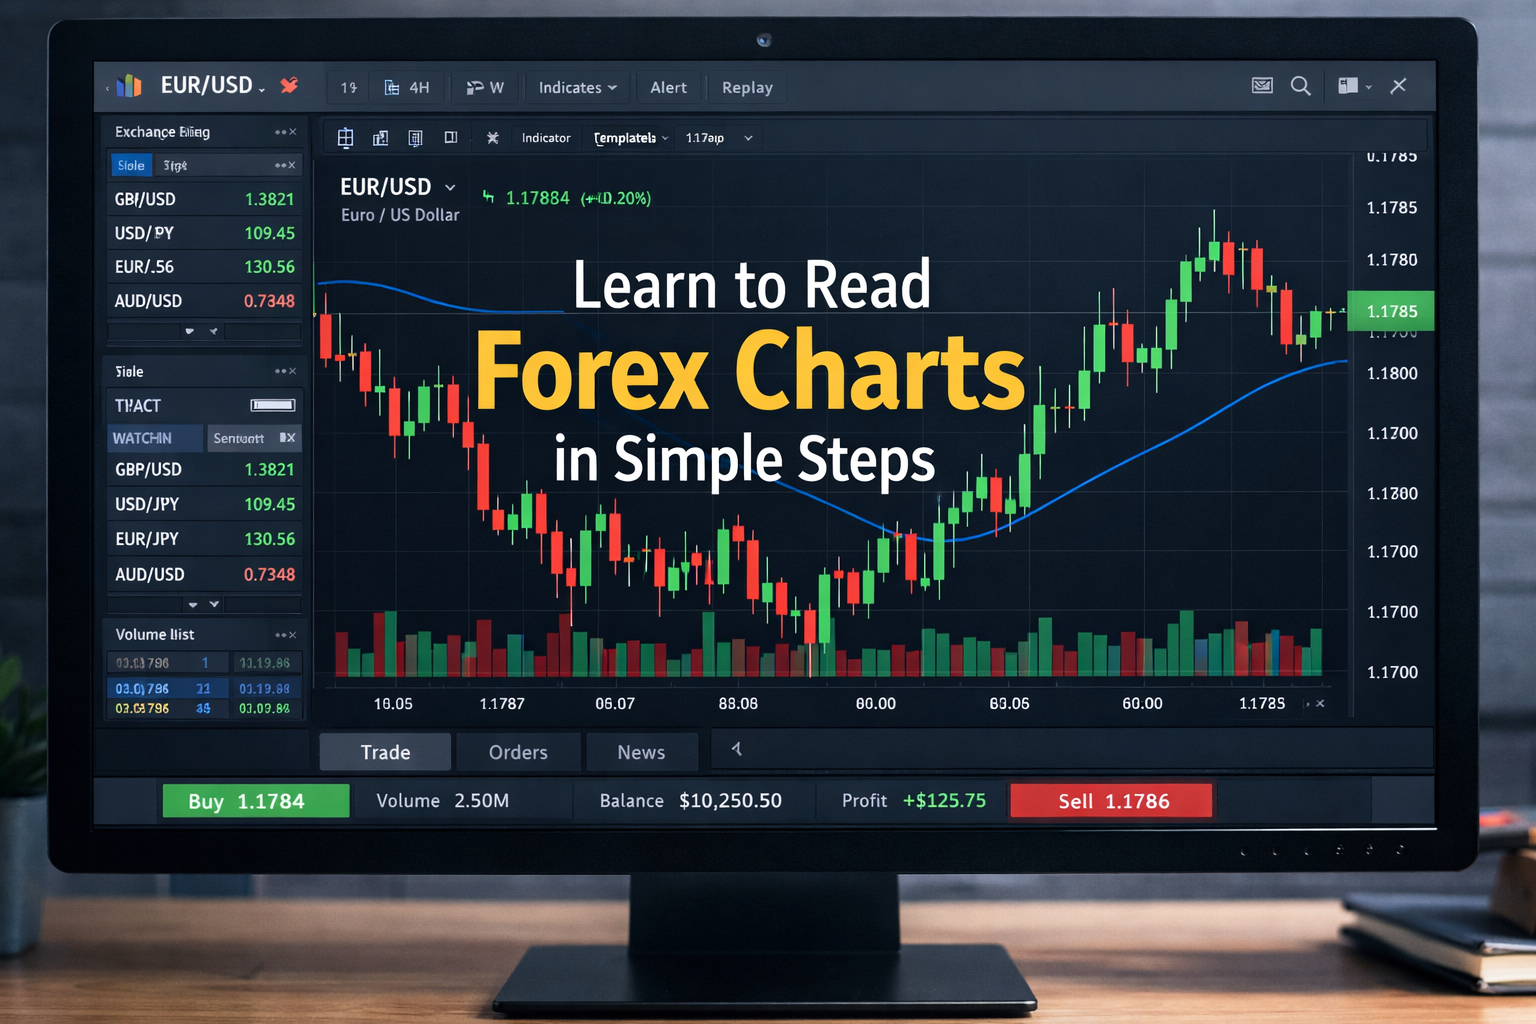
Forex charts are visual tools that show how the price of currency pairs moves over time. They help traders understand market behavior by displaying price changes in a clear and structured way. If you are learning how to read forex charts, this is the first concept you need to understand because charts are where all trading decisions begin.
Each forex chart represents the exchange rate between two currencies, such as EUR/USD or GBP/USD. The chart updates continuously as the market moves, allowing traders to see real-time price action. By studying these movements, traders can identify trends, patterns, and potential opportunities. This is why learning how to read forex charts is essential for anyone who wants to trade successfully.
Forex charts come in different types, including line charts, bar charts, and candlestick charts. Each type presents data in a slightly different way, but they all serve the same purpose of helping traders analyze the market. As you continue practicing how to read forex charts, you will naturally become more comfortable using these chart types to make informed decisions.
Another important aspect of forex charts is timeframes. Charts can show price movements over minutes, hours, days, or even months. This flexibility allows traders to choose a style that fits their strategy. Whether you are a short-term trader or a long-term investor, understanding how to read forex charts will help you interpret price movements more effectively.
Why Learning Charts Is Important?
Learning forex charts is the backbone of successful trading, yet many beginners ignore its importance. If you truly want to grow as a trader, mastering how to read forex charts is not optional—it is essential. Charts are the language of the market, and once you understand them, everything becomes clearer and more structured.
When you learn how to read forex charts, you start to see patterns instead of random price movements. Trends, reversals, and breakouts become easier to identify, allowing you to make smarter trading decisions. This reduces emotional trading and replaces it with a logical, data-driven approach.
Another major benefit of understanding how to read forex charts is improved trade timing. Many traders lose money not because their idea is wrong, but because their entry or exit is poor. Charts help you pinpoint the best moments to enter a trade and when to take profits or cut losses.
Risk management also becomes more effective when you know how to read forex charts. You can clearly identify support and resistance levels, place stop-loss orders strategically, and protect your capital from unnecessary risks. This is what separates professional traders from beginners.
Types of Forex Charts
Understanding different types of forex charts is a key step in mastering how to read forex charts effectively. Each chart type presents price data in a unique way, helping traders analyze the market from different perspectives. Among the most common chart types are line charts and bar charts, both of which are widely used by beginners and experienced traders.
Line Charts Explained
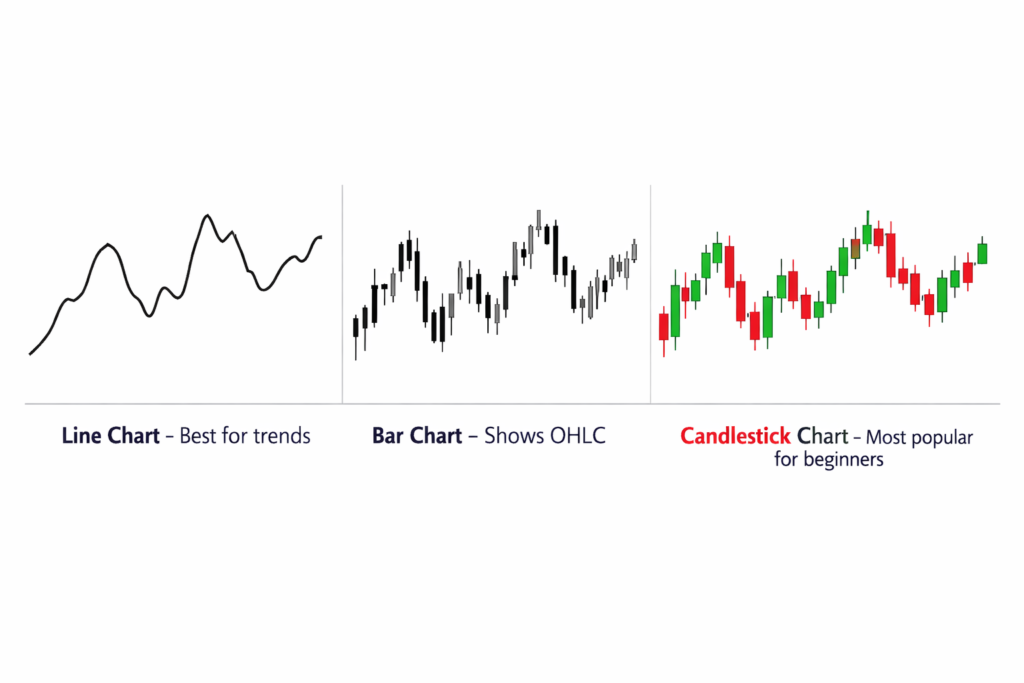
A line chart is the simplest type of forex chart. It connects closing prices over a specific period with a continuous line, making it easy to see the overall direction of the market. For beginners learning how to read forex charts, line charts are a great starting point because they remove unnecessary noise and focus only on price trends.
Line charts are especially useful for identifying long-term trends. They help traders quickly understand whether the market is moving up, down, or sideways. However, since they only show closing prices, they do not provide detailed information about price fluctuations within a timeframe.
Even with their simplicity, line charts play an important role in learning how to read forex charts, as they build a strong foundation for understanding price movement before moving on to more complex chart types.
Bar Charts Explained
Bar charts provide more detailed information compared to line charts. Each bar represents four key price points: the opening price, closing price, highest price, and lowest price within a specific time period. This makes them highly useful for traders who want a deeper understanding of market activity.
When studying how to read forex charts, bar charts help you analyze volatility and price behavior more accurately. The vertical line shows the price range, while small horizontal lines on each side indicate opening and closing prices.
Bar charts are ideal for traders who want more data without the visual complexity of candlestick charts. They allow you to see how the market moved within each time period, which improves decision-making and trade planning.
Mastering bar charts is another important step in improving your skills in how to read forex charts, as they offer a balance between simplicity and detailed analysis.
Candlestick Charts Explained
Candlestick charts are the most popular and widely used chart type in forex trading. They provide detailed information about price movements and are essential for anyone learning how to read forex charts effectively. Unlike line charts, candlesticks show the open, close, high, and low prices within a specific time period, giving traders a complete picture of market activity.
Each candlestick has two main parts: the body and the wicks (also called shadows). The body represents the difference between the opening and closing price, while the wicks show the highest and lowest prices reached during that time. If the closing price is higher than the opening price, the candle is usually bullish. If the closing price is lower, the candle is bearish.
Understanding candlestick patterns is a major step in mastering how to read forex charts. Patterns like doji, engulfing candles, and hammer formations can signal potential reversals or trend continuations. These patterns help traders predict what might happen next in the market.
Another advantage of candlestick charts is that they clearly show market sentiment. By learning how to read forex charts, traders can quickly identify whether buyers or sellers are in control. This insight helps in making better entry and exit decisions.
Candlestick charts also improve timing and accuracy. When you understand how to read forex charts, you can use candlestick signals to confirm your trading strategy and avoid false entries. This makes your trading more precise and confident.
In summary, candlestick charts are a powerful tool that every trader should master. They not only simplify complex price data but also enhance your ability to read forex charts, helping you trade smarter and more effectively.
Understanding Timeframes
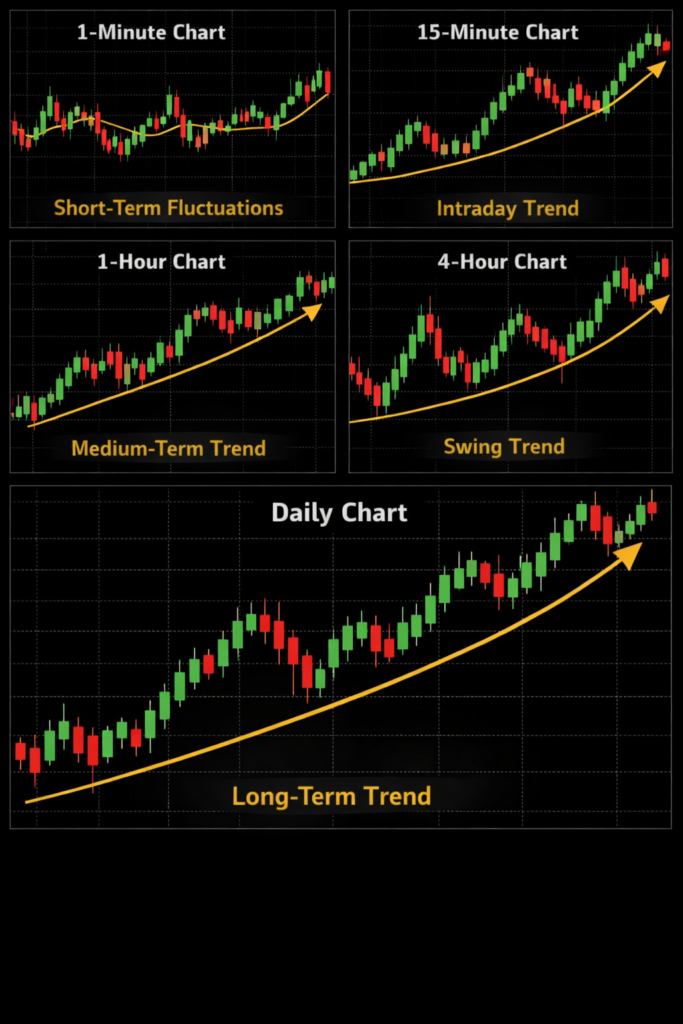
Timeframes are a crucial part of forex trading because they determine how price data is displayed on a chart. Whether you are a beginner or an experienced trader, understanding timeframes is essential for improving your skills in how to read forex charts. Each timeframe represents a specific period, such as 1 minute, 5 minutes, 1 hour, or even daily and weekly charts.
When learning how to read forex charts, it is important to know that different timeframes serve different purposes. Lower timeframes, like 1-minute or 5-minute charts, are commonly used by scalpers and day traders who look for quick trading opportunities. On the other hand, higher timeframes, such as daily or weekly charts, are preferred by swing traders and long-term investors who focus on bigger market trends.
One key benefit of understanding timeframes is better decision-making. By mastering how to read forex charts, traders can analyze the same currency pair across multiple timeframes to get a clearer picture of the market. This approach, known as multi-timeframe analysis, helps confirm trends and reduces the chances of making wrong trades.
Timeframes also play a major role in risk management. When you understand how to read forex charts, you can choose a timeframe that matches your trading style and risk tolerance. For example, shorter timeframes may offer more opportunities but come with higher risk, while longer timeframes provide more stable and reliable signals.
Finally, selecting the right timeframe improves consistency in trading. As you continue practicing how to read forex charts, you will discover which timeframes work best for your strategy and personality. This clarity helps you stay disciplined and avoid confusion caused by switching between too many chart views.
Support and Resistance Basics
Support and resistance are two of the most important concepts in forex trading. They help traders understand where the price is likely to stop, reverse, or continue. If you want to master how to read forex charts, learning support and resistance is absolutely essential.
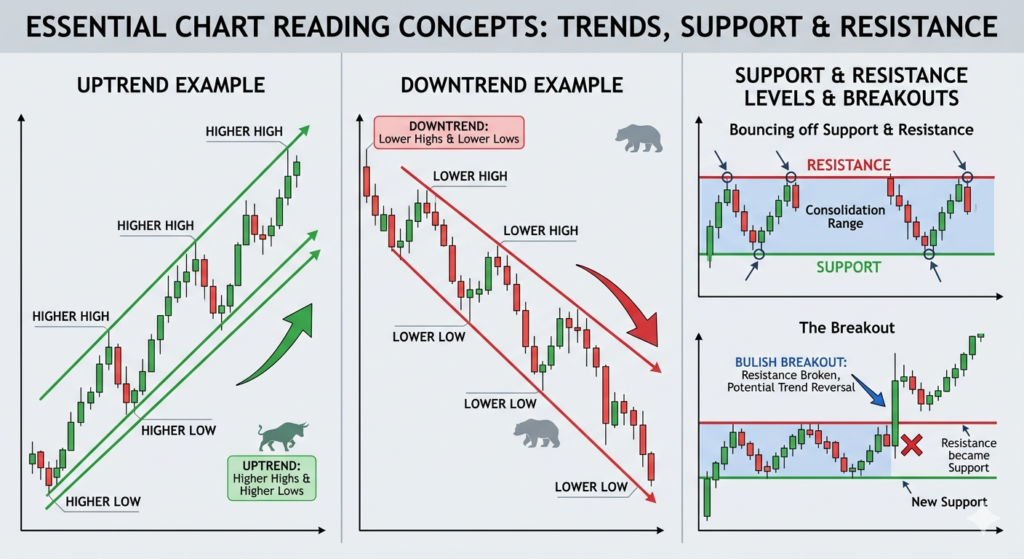
Support is a price level where the market tends to stop falling and may bounce upward. This happens because buyers enter the market and create demand. On the other hand, resistance is a level where the price often stops rising and may reverse downward due to increased selling pressure.
When learning how to read forex charts, these levels act like invisible barriers on the chart. Price does not move randomly; it reacts to these zones repeatedly. By identifying support and resistance, traders can predict potential entry and exit points more accurately.
Another key benefit of understanding support and resistance is improved risk management. As you develop your skills in how to read forex charts, you can place stop-loss orders just below support or above resistance. This helps protect your capital and reduces unnecessary losses.
Support and resistance levels also help traders understand market psychology. When price approaches support, traders expect it to rise, and when it nears resistance, they anticipate a drop. By mastering how to read forex charts, you can use this behavior to your advantage and make more confident trading decisions.
It is also important to remember that once a support level is broken, it can turn into resistance, and vice versa. This concept, known as a role reversal, is widely used by experienced traders and becomes easier to spot as you improve at reading forex charts.
Trends and Trendlines
Trends are the backbone of forex trading, helping traders understand the general direction of the market. A trend shows whether prices are moving upward, downward, or sideways over a period of time. Learning how to read forex charts makes it much easier to identify trends and take advantage of them.
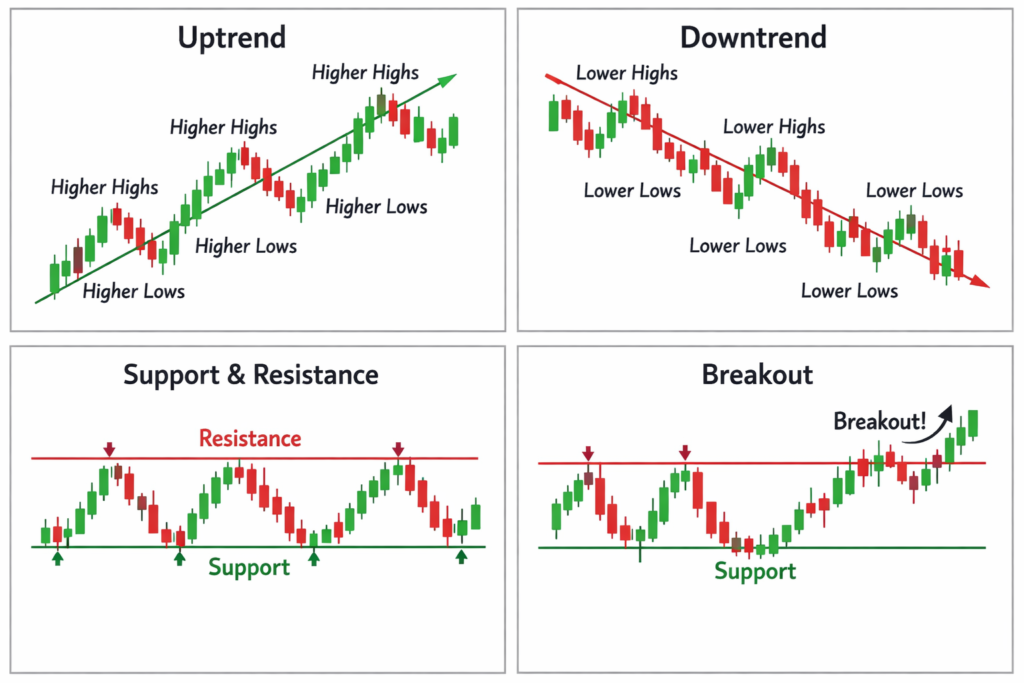
An uptrend occurs when prices consistently make higher highs and higher lows. This indicates that buyers are in control, and traders look for opportunities to buy. Conversely, a downtrend happens when prices make lower highs and lower lows, showing that sellers dominate the market. A sideways trend, also called a range, occurs when prices move within a horizontal channel, and the market lacks a clear direction.
Trendlines are tools that help traders visualize trends on a chart. By connecting consecutive highs or lows, trendlines provide a clear path of price movement. When learning how to read forex charts, trendlines are essential for spotting potential support in uptrends and resistance in downtrends.
Trends and trendlines also play a major role in trading decisions. Knowing the trend helps traders align their trades with the market’s direction, which increases the chances of success. Additionally, breakouts from trendlines can signal reversals or continuation patterns, offering opportunities for profitable trades.
Mastering trends and trendlines improves timing, strategy, and risk management. By consistently practicing how to read forex charts, traders can identify strong trends, avoid false signals, and make more confident decisions. In short, understanding trends and trendlines is fundamental to becoming a skilled forex trader.
Technical Indicators Overview
Technical indicators are tools that help traders analyze price movements and make better trading decisions. They are based on mathematical calculations using price, volume, or both. If you want to master how to read forex charts, understanding technical indicators is an important step that can greatly improve your analysis.
Indicators are mainly used to identify trends, measure market strength, and find potential entry and exit points. When learning how to read forex charts, traders often use indicators to confirm what they already see on the chart, rather than relying on them alone.
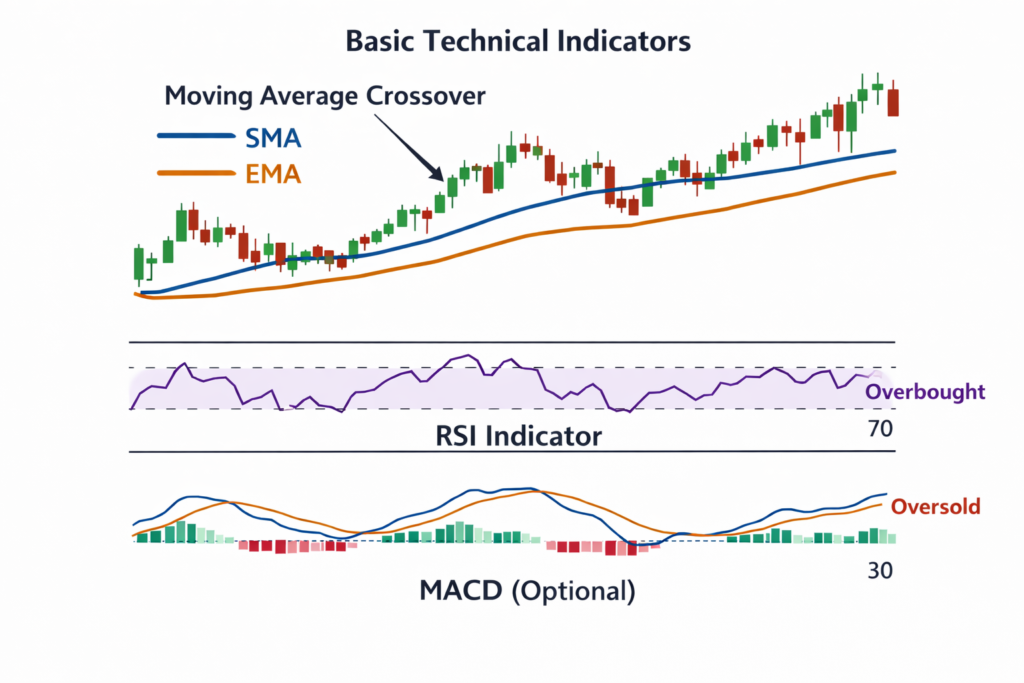
There are different types of technical indicators. Trend indicators, such as moving averages, help identify the direction of the market. Momentum indicators, like RSI (Relative Strength Index), show whether the market is overbought or oversold. Volatility indicators, such as Bollinger Bands, help traders understand how much the price is moving.
Using indicators correctly is essential. Many beginners make the mistake of adding too many indicators, which creates confusion. As you improve in how to read forex charts, it is better to use a few reliable indicators and combine them with price action for clearer signals.
Technical indicators also help improve timing and accuracy. By mastering how to read forex charts, traders can use indicators to confirm trends, avoid false signals, and make more confident trading decisions.
Volume in Forex Trading
Volume in forex trading refers to the number of trades or the amount of activity happening in the market during a specific period. Unlike stock markets, forex does not have a centralized exchange, so traders usually rely on tick volume, which shows how many times the price has changed. Understanding volume is an important step in mastering how to read forex charts effectively.
Volume helps traders confirm trends. When price is moving in a certain direction with high volume, it indicates strong interest from traders and increases the chances that the trend will continue. As you improve in how to read forex charts, you will notice that strong trends are often supported by increasing volume.
On the other hand, low volume can signal weakness in the market. If a price move happens with low volume, it may not be reliable and could reverse quickly. This is why traders who understand how to read forex charts use volume to avoid false breakouts and weak signals.
Volume is also useful for spotting reversals. For example, if there is a sudden spike in volume after a long trend, it may indicate that the trend is coming to an end. By learning how to read forex charts, traders can combine volume with price action to identify these turning points more accurately.
Common Beginner Mistakes
Starting forex trading can be exciting, but many beginners make mistakes that slow down their progress and lead to losses. Understanding these mistakes early can help you improve faster and strengthen your ability in how to read forex charts.
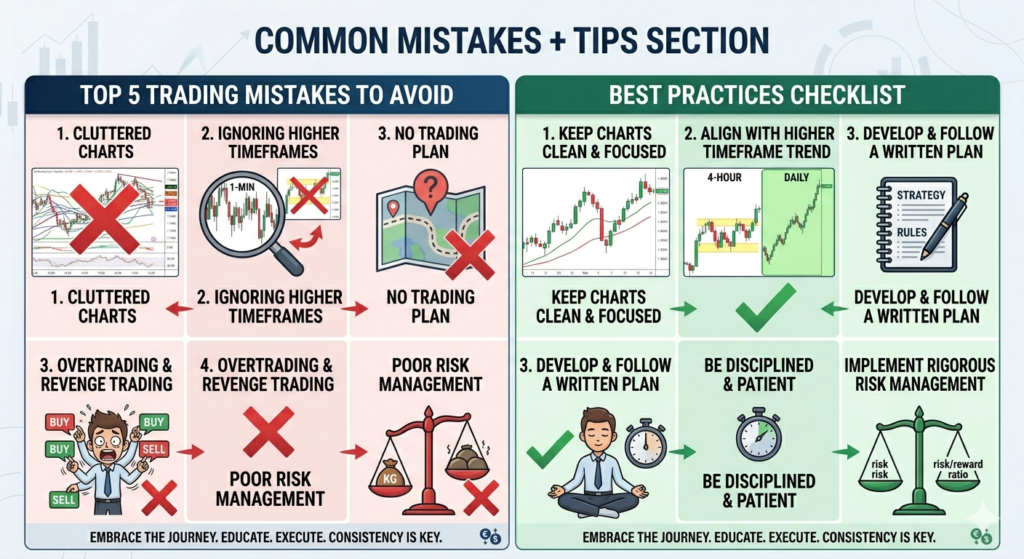
One of the most common mistakes is trading without proper knowledge. Many beginners jump into the market without learning how to read forex charts, which leads to poor decisions based on guesswork rather than analysis. Taking time to learn the basics is essential for long-term success.
Another mistake is overtrading. New traders often open too many trades in a short time, thinking it will increase profits. However, without a clear understanding of how to read forex charts, this usually results in unnecessary losses and emotional stress.
Ignoring risk management is also a major problem. Beginners often risk too much on a single trade, which can quickly wipe out their accounts. By learning how to read forex charts, traders can identify better entry points and set proper stop-loss levels to protect their capital.
Many beginners also rely too much on signals or other traders. While guidance can be helpful, depending completely on others prevents you from developing your own skills. Mastering how to read forex charts allows you to trade independently and make confident decisions.
Emotional trading is another big mistake. Fear and greed often cause traders to exit trades too early or hold losing trades for too long. A solid understanding of how to read forex charts helps reduce emotional decisions by providing clear, logical signals.
Finally, lack of patience is a common issue. Successful trading requires discipline and time. Beginners who rush the process often fail, while those who focus on improving how to read forex charts gradually build consistency and confidence.
Step-by-Step Chart Reading Strategy
Reading forex charts can feel overwhelming at first, but following a clear step-by-step process makes it much easier. By building a structured approach, you can improve your accuracy and confidence in how to read forex charts.
1. Identify the Trend
Start by looking at the overall market direction. Check whether the price is moving up, down, or sideways. This is the foundation of how to read forex charts, as trading with the trend increases your chances of success.
2. Choose the Right Timeframe
Select a timeframe that matches your trading style. For example, lower timeframes are better for short-term trades, while higher timeframes are ideal for long-term analysis. Understanding this step helps refine how to read forex charts more effectively.
3. Mark Support and Resistance Levels
Draw key levels where price has previously reversed or paused. These levels act as decision zones in the market. A strong understanding of how to read forex charts allows you to use these zones for better entries and exits.
4. Analyze Candlestick Patterns
Look for patterns such as engulfing candles, doji, or pin bars. These patterns provide clues about market sentiment. This step enhances your ability in how to read forex charts by helping you predict possible price movements.
5. Use Technical Indicators for Confirmation
Add a few indicators like moving averages or RSI to confirm your analysis. Avoid using too many indicators, as it can create confusion. Proper use of indicators strengthens your skills in how to read forex charts.
6. Check Volume
Volume helps confirm the strength of a trend or breakout. High volume often supports strong moves, while low volume may indicate weak signals. Including volume analysis improves your understanding of how to read forex charts.
7. Plan Your Entry and Exit
Decide where to enter the trade, where to place your stop-loss, and where to take profit. This step ensures discipline and reduces emotional trading. It is a key part of mastering how to read forex charts.
8. Review and Learn
After each trade, review what worked and what didn’t. This helps you improve over time and avoid repeating mistakes. Continuous practice is essential for mastering how to read forex charts.
FAQs
1. What is a forex chart?
A forex chart is a visual representation of how a currency pair’s price changes over time. It shows price on the vertical axis and time on the horizontal axis.
Understanding this basic concept is the first step in learning how to read forex charts.
2. How do beginners start learning how to read forex charts?
Beginners should start by understanding chart types (line, bar, candlestick), then learn trends, support/resistance, and basic indicators.
A simple approach is to first identify the trend, then analyze price behavior step by step.
3. What is the easiest chart type for beginners?
Line charts are the easiest because they show only closing prices and simple trends. However, most traders prefer candlestick charts because they provide more detailed information.
Learning both is important when mastering how to read forex charts.
4. What do candlesticks show?
Candlesticks show four key price points:
- Open
- Close
- High
- Low
They help traders understand market sentiment and price movement clearly, which is essential in how to read forex charts.
5. What is a pip in forex charts?
A pip is the smallest price movement in a currency pair. For most pairs, it is 0.0001.
Knowing pips is important when learning how to read forex charts, as it helps measure profit and loss.
A forex chart is a visual representation of how a currency pair’s price changes over time. It shows price on the vertical axis and time on the horizontal axis.
Understanding this basic concept is the first step in learning how to read forex charts.
Beginners should start by understanding chart types (line, bar, candlestick), then learn trends, support/resistance, and basic indicators.
A simple approach is to first identify the trend, then analyze price behavior step by step.
Line charts are the easiest because they show only closing prices and simple trends. However, most traders prefer candlestick charts because they provide more detailed information.
Learning both is important when mastering how to read forex charts.
Candlesticks show four key price points:
- Open
- Close
- High
- Low
They help traders understand market sentiment and price movement clearly, which is essential in how to read forex charts.
A pip is the smallest price movement in a currency pair. For most pairs, it is 0.0001.
Knowing pips is important when learning how to read forex charts, as it helps measure profit and loss.
Conclusion
Learning forex chart reading is the foundation of becoming a successful trader. Throughout this guide, you have explored different chart types, timeframes, support and resistance, trends, indicators, and volume—all of which play a vital role in understanding the market. Mastering how to read forex charts is not just about memorizing concepts, but about applying them consistently in real trading situations.
At the beginning, charts may seem confusing, but with practice, they become much easier to understand. As you continue improving your skills in how to read forex charts, you will start to recognize patterns, trends, and trading opportunities with greater clarity and confidence.
It is important to remember that no strategy is perfect. The key is to combine knowledge with discipline, patience, and proper risk management. Traders who focus on improving how to read forex charts over time are more likely to achieve consistent results rather than quick profits.
In the end, success in forex trading comes from continuous learning and experience. Stay consistent, keep practicing, and always aim to refine your understanding of how to read forex charts. With the right mindset and approach, you can turn chart reading into a powerful skill that supports long-term trading success.