Table of Contents
ToggleIntroduction
When I first started trading, I believed that success came from finding the perfect indicator or a winning strategy. I spent hours testing different indicators, watching YouTube tutorials, and changing my chart setup almost every week. Although TradingView was my go-to charting platform, I was only using its basic features and had no idea how many powerful tools were hidden inside it.
Everything changed when I decided to explore the platform beyond the default settings. Instead of searching for another “holy grail” indicator, I focused on learning the Hidden TradingView Features that many traders overlook. I quickly realized that these built-in tools could make chart analysis faster, improve my workflow, and help me stay more organized during every trading session.
Over the past few years, I have used TradingView almost every day to analyze gold, forex, and other financial markets. Through this experience, I discovered that the Hidden TradingView Features weren’t just convenient—they genuinely improved the way I approached technical analysis. From managing multiple watchlists and creating smarter alerts to using Replay Mode for practice, these features helped me save time and reduce unnecessary mistakes.
In this article, I’m sharing the Hidden TradingView Features that have had the biggest impact on my trading journey. These are not secret hacks or shortcuts to guaranteed profits. Instead, they are practical tools that I personally use to keep my charts clean, improve my analysis, and make my daily trading routine more efficient. If you’re already using TradingView, learning these Hidden TradingView Features can help you unlock the platform’s full potential and take your charting experience to the next level.
Why I Started Exploring Hidden TradingView Features
When I first started using TradingView, I thought I already knew everything I needed. I used a few indicators, drew support and resistance levels, and switched between different timeframes to analyze the market. At the time, I believed that finding the perfect trading strategy was the key to becoming a better trader. I never imagined that the platform itself had so many powerful tools waiting to be discovered.
As I spent more time trading, I realized that my biggest challenge wasn’t finding new indicators—it was making my chart analysis faster, cleaner, and more organized. I noticed that experienced traders could analyze charts much more efficiently than I could, so I started exploring every menu, setting, and option inside TradingView. That’s when I began discovering several Hidden TradingView Features that completely changed the way I used the platform.
Some of these Hidden TradingView Features helped me save time by reducing repetitive tasks, while others made my chart analysis more accurate and organized. Features like custom watchlists, drawing tool shortcuts, Replay Mode, and trendline alerts quickly became part of my daily trading routine. Although these tools didn’t guarantee profitable trades, they made my workflow much more efficient and allowed me to focus more on understanding price action instead of constantly managing my charts.
Looking back, learning these Hidden TradingView Features was one of the best decisions I made as a trader. Instead of searching for another indicator or strategy, I invested time in mastering the platform I use every day. That small change made a noticeable difference in my productivity and confidence while analyzing the markets. In this article, I’m sharing the same features that have helped me become a more organized and efficient trader, and I hope they can improve your trading experience as well.
How These Features Improved My Trading
When I first started using TradingView, my chart analysis often felt slow and unorganized. I spent too much time switching between tools, adjusting indicators, and searching for features that could have been accessed much faster. As I began using more Hidden TradingView Features, I noticed that my workflow became smoother and my daily analysis required far less effort.
One of the biggest improvements was the amount of time I saved. Simple features like the Favorites Toolbar, keyboard shortcuts, and indicator templates allowed me to set up my charts within minutes instead of repeating the same tasks every day. This gave me more time to focus on what really matters—understanding price action and planning quality trades.
Another major benefit was better chart organization. Before discovering these Hidden TradingView Features, my charts were often cluttered with unnecessary drawings and indicators. After learning how to use tools like the Object Tree, locked drawings, and synchronized layouts, my workspace became much cleaner. A clean chart helped me make clearer trading decisions without unnecessary distractions.
These features also improved my risk management. The built-in Long and Short Position Tool made it much easier to calculate my risk-to-reward ratio before entering a trade. Instead of estimating stop-loss and take-profit levels manually, I could quickly visualize whether a setup was worth taking. This helped me become more disciplined and avoid impulsive trades.
Another feature that made a noticeable difference was Bar Replay. I regularly use it to review historical market movements and test trading ideas without seeing future price action. This practice has helped me build confidence in my strategies and better understand how different market conditions affect trade setups.
Most importantly, these Hidden TradingView Features changed the way I approached trading. I stopped looking for shortcuts and focused on building an efficient routine. While these tools didn’t guarantee profitable trades, they made my analysis faster, my charts more organized, and my overall trading process much more consistent. Looking back, learning these features has been one of the most valuable investments I’ve made in improving my trading workflow.
Feature #1 – Favorite Toolbar
One of the first Hidden TradingView Features that made a noticeable difference in my daily trading routine was the Favorite Toolbar. It may seem like a small feature, but after using it for a while, I realized how much time it saves during chart analysis.
When I first started using TradingView, I had to open the drawing tools menu every time I wanted to add a trendline, horizontal line, Fibonacci retracement, or rectangle. It wasn’t a major problem, but after analyzing dozens of charts every day, those extra clicks started adding up. I found myself repeating the same actions over and over again.
That’s when I discovered the Favorite Toolbar. This feature allows you to pin your most-used drawing tools so they are always visible on your chart. Instead of searching through different menus, I can access my favorite tools with a single click, making my analysis much faster and more efficient.
For my trading style, I have added the following tools to my Favorite Toolbar:
- Trend Line
- Horizontal Line
- Fibonacci Retracement
- Rectangle Tool
- Long Position Tool
- Short Position Tool
- Text Labels
These are the tools I use almost every day while analyzing gold and forex charts. Having them readily available keeps my workflow smooth and helps me stay focused on price action instead of navigating through menus.
How to Set Up the Favorite Toolbar
Setting up the Favorite Toolbar is very simple:
- Open the Drawing Tools panel on the left side of TradingView.
- Hover over the tool you use most often.
- Click the Star (⭐) icon next to the tool.
- The tool will automatically appear in your floating Favorite Toolbar.
You can add or remove tools at any time, allowing you to customize the toolbar based on your trading strategy.
Why I Use It Every Day
Out of all the Hidden TradingView Features, this is one that I use in every trading session. It helps me analyze charts more quickly, reduces repetitive clicks, and keeps my favorite tools within easy reach. Although it doesn’t improve your trading strategy directly, it makes the entire charting process much more efficient.
In my experience, small improvements like this can make a big difference over time. When you’re analyzing multiple charts every day, saving even a few seconds on each task adds up, allowing you to focus more on finding high-quality trade setups rather than managing your workspace.
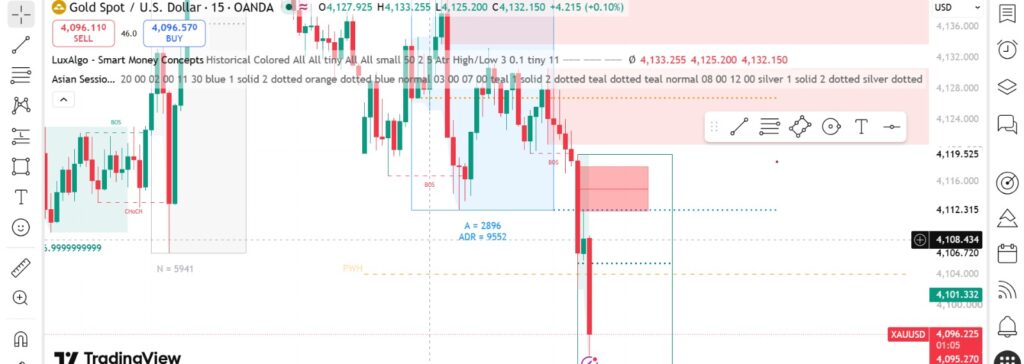
Instead of opening the drawing tools menu repeatedly, I have pinned my most frequently used tools to a floating toolbar that appears directly on the chart. This allows me to perform technical analysis much faster and keeps my workflow smooth.
Feature #2 – Magnet Mode
Another one of my favorite Hidden TradingView Features is Magnet Mode. I didn’t start using it until several months into my trading journey, but once I discovered it, I realized how useful it is for drawing accurate trendlines and support or resistance levels.
In the beginning, I used to draw trendlines manually, and many of them didn’t align perfectly with the candle highs and lows. Even a small mistake in placing a trendline could lead to inaccurate analysis, especially when trading fast-moving markets like gold. I often found myself adjusting the same line multiple times just to make it fit correctly.
That’s when I discovered Magnet Mode.
Magnet Mode automatically snaps your drawing tools to the nearest candle’s high, low, open, or close, depending on where you place your cursor. Instead of trying to position your trendline perfectly by hand, TradingView helps you anchor it precisely to the price data. This makes your drawings more accurate and consistent.

Feature #3 – Long & Short Position Tool
One of the most valuable Hidden TradingView Features that completely changed the way I plan my trades is the Long & Short Position Tool. Before I started using it, I used to calculate my stop loss, take profit, and risk-to-reward ratio manually. Not only did it take extra time, but it also increased the chances of making mistakes, especially during fast-moving market sessions.
After discovering this built-in TradingView tool, my trade planning became much more structured. Now, before entering any trade, I use the Long Position Tool for buy setups and the Short Position Tool for sell setups. It allows me to visualize the entire trade directly on the chart before risking any money.
Why I Use It Every Day
Whenever I identify a potential trade setup, I don’t enter the market immediately. Instead, I first place the Long or Short Position Tool on the chart to see if the trade offers a favourable risk-to-reward ratio.
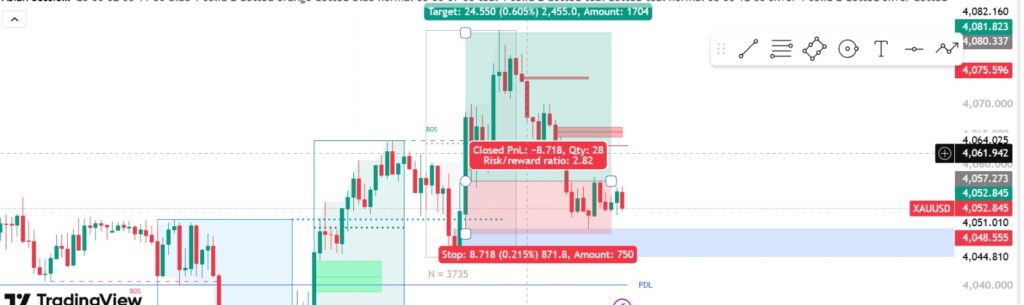
For example, if I’m buying Gold (XAU/USD), I place the Long Position Tool at my planned entry point. I then adjust the stop loss below the nearest support level and move the take-profit target to the next resistance area. Within seconds, I can see whether the trade fits my trading plan.
If I’m looking for a sell opportunity, I simply use the Short Position Tool and follow the same process.
How to Use the Long & Short Position Tool
Using this feature is very straightforward:
- Open the left toolbar in TradingView.
- Select the Prediction and Measurement Tools section.
- Choose Long Position for buy trades or Short Position for sell trades.
- Click on your desired entry point.
- Drag the red area to set your stop loss.
- Drag the green area to set your take-profit target.
As you adjust the levels, TradingView automatically updates the risk-to-reward ratio and other trade statistics in real time.
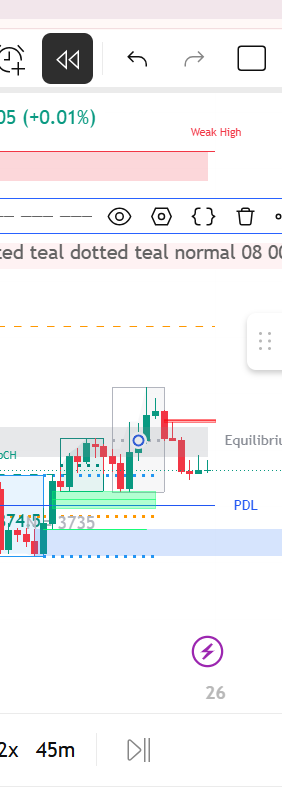
Feature #4 – Bar Replay
One of the most underrated Hidden TradingView Features that has helped me improve my trading skills is Bar Replay. When I first started trading, I believed that the only way to gain experience was by placing live trades. However, I quickly realized that learning through real-money mistakes can be both expensive and emotionally draining.
That’s when I discovered Bar Replay, and it completely changed the way I practice and test my strategies.
What Is Bar Replay?
Bar Replay is a built-in TradingView feature that allows you to travel back in time and replay historical market data one candle at a time. Instead of seeing the entire chart, you only see the price action up to a selected point, just as if you were trading live.
As each new candle appears, you can analyse the market, make trading decisions, and see how the trade would have played out without knowing what happens next.
This makes Bar Replay one of the most realistic ways to practice trading.
Feature #5 – Trendline Alerts
One of the smartest Hidden TradingView Features that has made my trading routine much more efficient is Trendline Alerts. Before I discovered this feature, I used to spend hours watching my charts, waiting for the price to reach an important trendline or support and resistance level. Most of the time, the market would either move before I was ready or I would waste valuable time staring at the screen.
After I started using Trendline Alerts, everything changed. Instead of constantly monitoring the market, I simply let TradingView notify me when the price reaches one of my key levels. This has saved me a lot of time and allowed me to focus only on high-probability trading opportunities.
What Are Trendline Alerts?
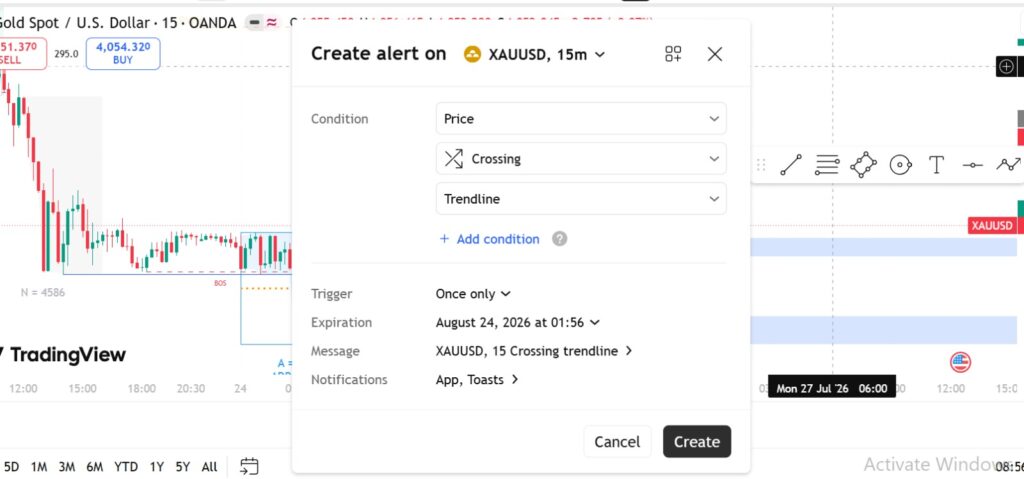
Trendline Alerts allow you to create notifications directly on your trendlines and other drawing tools. Rather than setting a fixed price alert, TradingView tracks the trendline itself. As the trendline extends over time, the alert automatically adjusts with it.
This means you don’t have to keep updating your alerts manually every time the market moves.
How to Set a Trendline Alert
Creating a Trendline Alert is very easy:
- Draw a trendline on your chart.
- Right-click on the trendline.
- Select Add Alert on Trendline.
- Choose your preferred alert conditions.
- Click Create.
Once the alert is active, TradingView will notify you when the price interacts with that trendline.
Feature #6 – Multiple Watchlists
One of the Hidden TradingView Features that has helped me stay organised is the ability to create Multiple Watchlists. When I first started trading, I kept every market in a single watchlist. It included Gold, Forex pairs, cryptocurrencies, indices, and even stocks. After a while, my watchlist became cluttered, and I spent too much time searching for the assets I actually wanted to trade.
As my trading experience grew, I realised that keeping everything in one list was slowing down my analysis. That’s when I discovered that TradingView allows you to create multiple watchlists for different markets and trading strategies. Since then, my workflow has become much more efficient.
What Are Multiple Watchlists?
Multiple Watchlists allow you to organise different financial markets into separate categories instead of keeping them all in one long list. Rather than scrolling through dozens of symbols, you can switch between customised watchlists with just a few clicks.
This simple feature helps keep your workspace clean and makes it easier to focus on the markets you trade most often.
How I Organise My Watchlists
I prefer to separate my markets based on the type of assets I trade. My watchlists look something like this:
- Gold Trading
- XAU/USD
- Silver (XAG/USD)
- Major Forex Pairs
- EUR/USD
- GBP/USD
- USD/JPY
- AUD/USD
- Cryptocurrencies
- Bitcoin (BTC/USD)
- Ethereum (ETH/USD)
- Solana (SOL/USD)
- Indices
- US30
- NASDAQ
- S&P 500
Feature #7 – Multi-Chart Layout
One of the Hidden TradingView Features that completely changed the way I analyse the markets is the Multi-Chart Layout. Before I started using this feature, I constantly switched between different timeframes. I would analyse the Daily chart, then move to the 4-Hour chart, then the 1-Hour chart, and finally the 15-Minute chart. After a while, it became frustrating because I kept losing track of the bigger market picture.
When I discovered the Multi-Chart Layout feature, my entire trading workflow became much more organised. Instead of switching between charts, I can now view multiple timeframes on one screen at the same time. This has made my analysis faster, more accurate, and much more efficient.
What Is Multi-Chart Layout?
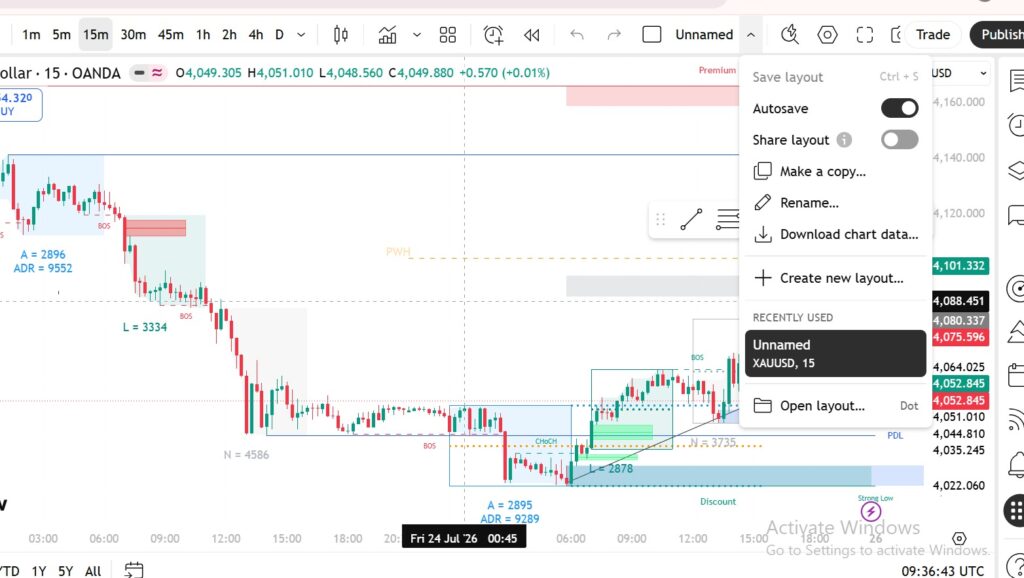
Multi-Chart Layout is a TradingView feature that allows you to display two, four, six, or even more charts in a single workspace, depending on your TradingView subscription. Each chart can have its own timeframe, making it easy to analyse the market from different perspectives without constantly changing timeframes.
For traders who rely on multi-timeframe analysis, this feature is a huge advantage.
How to Enable Multi-Chart Layout
Setting up the Multi-Chart Layout is simple:
- Open TradingView.
- Click the Select Layout icon at the top of the chart.
- Choose the number of charts you want to display.
- Assign a different timeframe to each chart.
- If available on your plan, synchronise symbols and drawings so all charts update together.
Within minutes, you’ll have a complete multi-timeframe trading workspace.
Feature #8 – Keyboard Shortcuts
One of the Hidden TradingView Features that I underestimated when I first started trading was Keyboard Shortcuts. At first, I thought using the mouse for everything was perfectly fine. But after spending several hours every day analysing charts, I realised that constantly clicking through menus was slowing me down.
Out of curiosity, I started learning some of TradingView’s keyboard shortcuts. It didn’t take long before they became part of my daily routine. Today, I rarely search for drawing tools because I can access most of them instantly using my keyboard.
What Are Keyboard Shortcuts?
Keyboard shortcuts are quick key combinations that allow you to perform actions without navigating through TradingView’s menus. Whether you want to draw a trendline, add a horizontal line, undo a mistake, or delete an object, you can do it in seconds with the right shortcut.
Although this might seem like a small feature, it can save a surprising amount of time when you’re analysing multiple charts every day.
Why I Started Using Keyboard Shortcuts
In the beginning, I spent a lot of time opening the drawing tools menu whenever I needed to mark support and resistance or draw a trendline. It wasn’t a major issue, but after analysing dozens of charts every week, those extra clicks became repetitive.
Once I learned a few essential shortcuts, my charting became much faster. Instead of interrupting my analysis to search for a tool, I could stay focused on the market and continue analysing without breaking my concentration.
| Shortcut | Function |
|---|---|
| Alt + T | Select the Trend Line tool |
| Alt + H | Add a Horizontal Line |
| Alt + F | Open the Fibonacci Retracement tool |
| Ctrl + Z | Undo the last action |
| Ctrl + Y | Redo the last action |
| Delete | Remove the selected drawing |
| Shift | Draw perfectly straight lines |