Table of Contents
ToggleWhat Is a TradingView Layout?
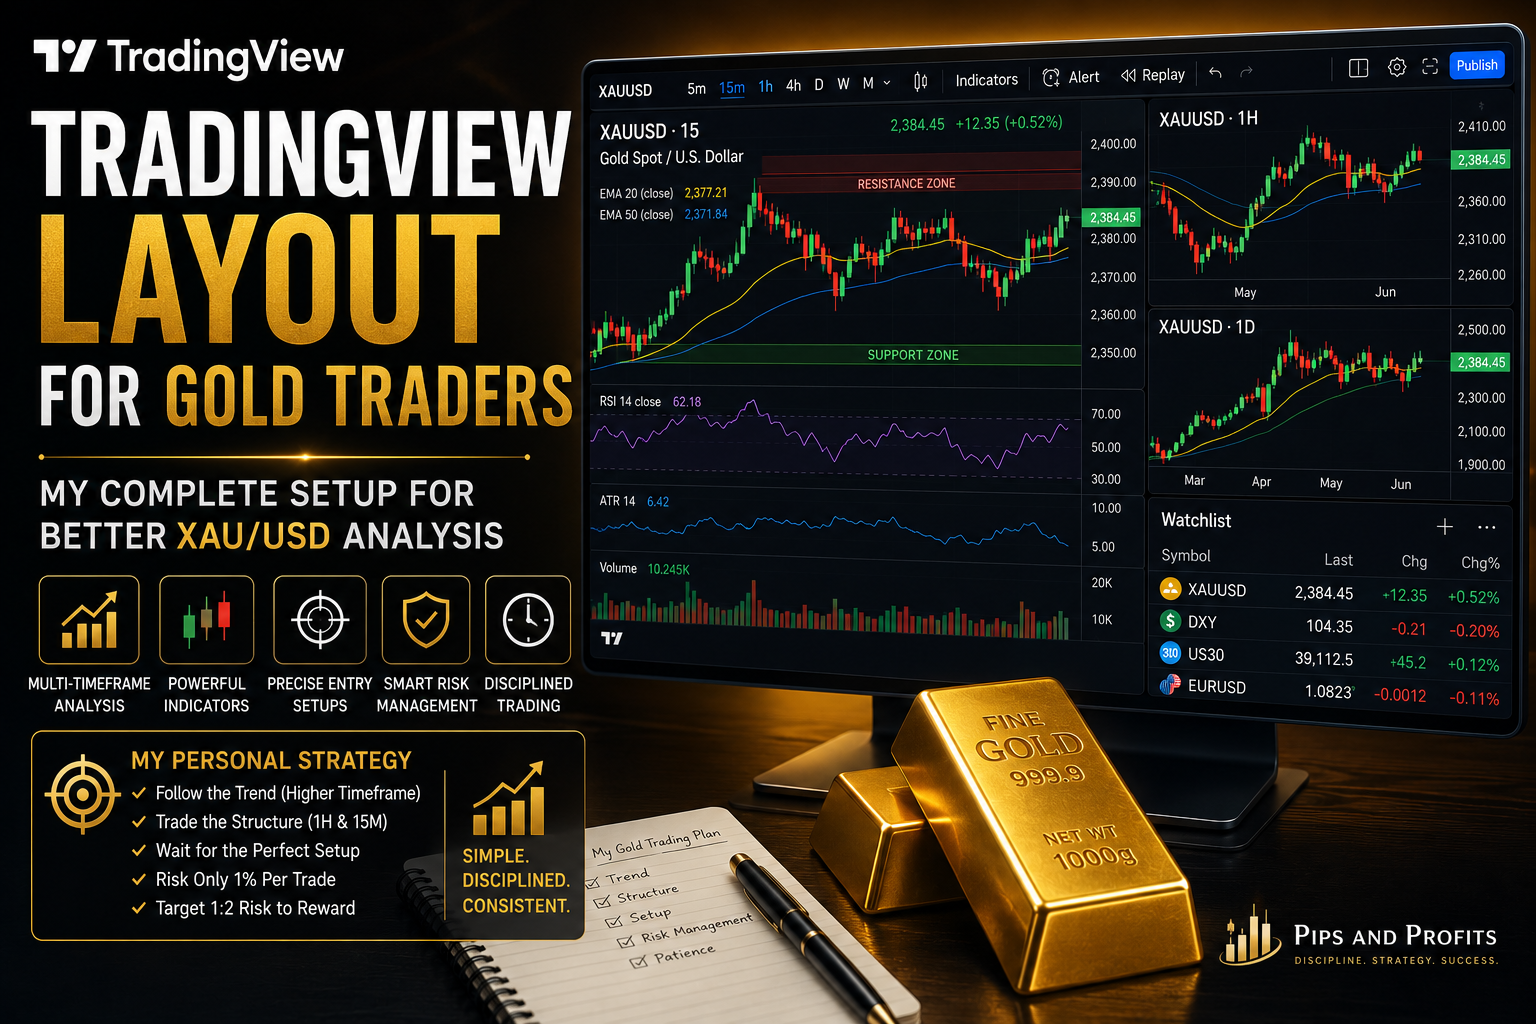
A TradingView Layout for Gold Traders is a customised workspace that organises your charts, indicators, watchlists, drawing tools, and trading panels into one efficient screen. Instead of switching between multiple tabs or windows, you can view everything you need to analyse the Gold (XAU/USD) market in one place.
A well-designed TradingView Layout for Gold Traders helps you stay organised and make faster, more confident trading decisions. You can display multiple timeframes—such as the Daily, 1-Hour, and 15-Minute charts—side by side to understand the overall trend while identifying precise entry and exit points.
One of TradingView’s biggest advantages is its flexibility. You can customise your layout by adding your favourite indicators, creating watchlists, saving drawing tools, and arranging charts to match your trading style. Whether you’re a scalper, day trader, or swing trader, a personalised layout makes your workflow more efficient.
For Gold traders, a clean and distraction-free workspace is often more effective than a chart overloaded with indicators. By focusing on price action, market structure, and a few reliable tools, your TradingView Layout for Gold Traders becomes a practical part of your trading strategy rather than just a collection of charts.
In the following sections, I’ll show you the exact TradingView Layout for Gold Traders that I personally use, explain why I chose each component, and demonstrate how it helps me analyse the XAU/USD market with greater consistency.
Why Gold Traders Need a Proper TradingView Layout
Gold (XAU/USD) is one of the most volatile financial instruments, with prices often moving sharply during major economic news releases and the London and New York trading sessions. Without an organised workspace, it’s easy to miss important market signals or make rushed trading decisions. That’s why having a well-structured TradingView Layout for Gold Traders is so important.
A customised TradingView Layout for Gold Traders allows you to monitor multiple timeframes, identify the overall trend, and spot high-probability trade setups without constantly switching between charts. For example, you can use the Daily chart to find key support and resistance levels, the 1-hour chart to confirm the market trend, and the 15-minute chart to fine-tune your entries.
Another major benefit is improved focus. Many beginner traders overload their charts with too many indicators, making it difficult to interpret price action. A clean TradingView Layout for Gold Traders keeps only the tools that truly add value, helping you analyse the market with greater clarity and confidence.
A proper layout also saves time. With your favourite indicators, watchlist, drawing tools, and chart settings already arranged, you can begin analysing the market as soon as you open TradingView. This is especially useful during fast-moving market conditions when every second matters.
From my own trading experience, maintaining the same TradingView Layout for Gold Traders every day has helped me stay disciplined and consistent. Rather than changing my setup frequently, I focus on following my trading plan and waiting for quality opportunities. Consistency in your chart layout often leads to consistency in your decision-making, which is an essential part of long-term trading success.
My Personal TradingView Layout for Gold Traders
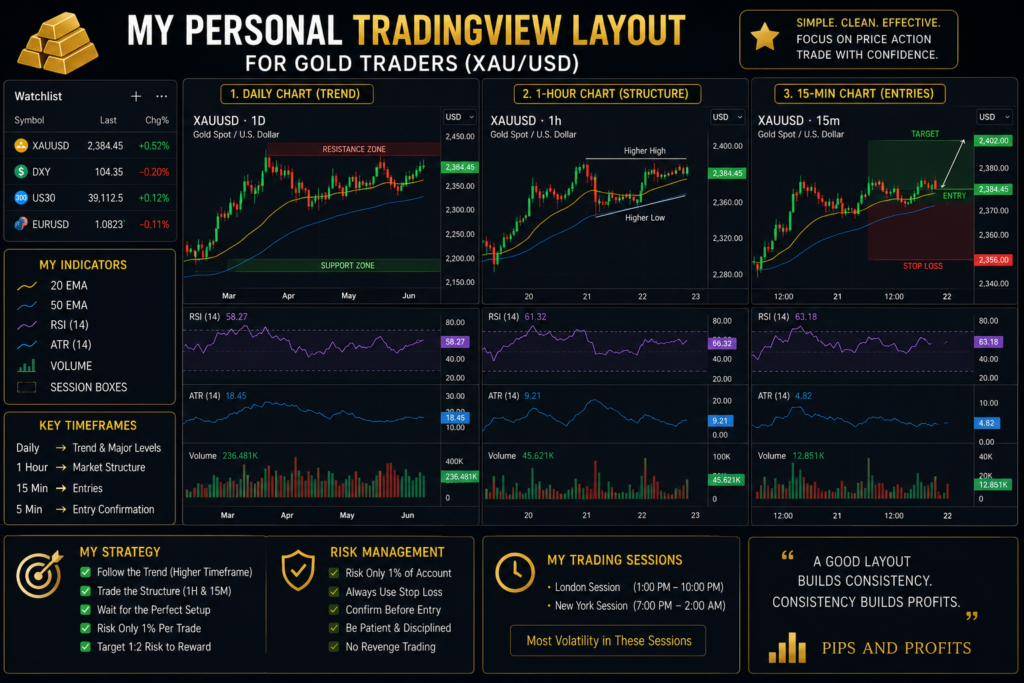
workspace delivers the best results. My TradingView Layout for Gold Traders is designed to help me analyse the Gold (XAU/USD) market quickly without being distracted by unnecessary indicators or cluttered charts.
I believe that successful trading isn’t about using dozens of indicators—it’s about understanding price action, market structure, and risk management. That’s why I keep my layout clean and focus only on the tools I use every trading day.
1. Daily Chart – Identifying the Major Trend
The first chart in my TradingView Layout for Gold Traders is the Daily timeframe. Before placing any trade, I check the overall market direction and mark important support and resistance zones. This gives me a clear picture of whether buyers or sellers are in control.
2. 1-Hour Chart – Analysing Market Structure
Next, I switch to the 1-hour chart to study the current market structure. Here, I look for higher highs, higher lows, lower highs, or lower lows to confirm the trend. This timeframe helps me decide whether I should be looking for buying or selling opportunities.
3. 15-Minute Chart – Finding Trade Entries
Most of my trades are executed on the 15-minute chart. In my TradingView Layout for Gold Traders, this is where I wait for pullbacks, breakout confirmations, candlestick patterns, and trend continuation setups before entering a position.
4. Indicators I Use
I prefer using only a few reliable indicators instead of filling my screen with too much information. My regular setup includes:
- 20 EMA – To identify short-term trend direction.
- 50 EMA – To confirm the overall trend.
- RSI (Relative Strength Index) – To measure momentum and spot potential reversals.
- ATR (Average True Range) – To understand market volatility and set realistic stop-loss levels.
- Volume – To confirm the strength behind price movements.
These indicators support my analysis, but I always give priority to price action.
5. Watchlist
I keep my watchlist small to stay focused. It usually includes:
- XAU/USD
- DXY (US Dollar Index)
- US30
- EUR/USD
Monitoring only a few key markets helps me avoid unnecessary distractions and concentrate on the best trading opportunities.
6. Risk Management Is Part of My Layout
A good TradingView Layout for Gold Traders is more than just charts and indicators—it should support disciplined trading. Before every trade, I make sure my setup follows these rules:
- Risk only 1% of my trading account.
- Always use a stop-loss.
- Aim for at least a 1:2 risk-to-reward ratio.
- Never chase the market.
- Wait patiently for confirmation before entering a trade.
Why This Layout Works for Me
The reason I continue using this TradingView Layout for Gold Traders is its simplicity and consistency. Every chart has a purpose, every indicator adds value, and the entire setup helps me stay disciplined. Instead of constantly changing my strategy, I focus on following the same proven process every trading day, which has improved both my confidence and consistency when trading Gold (XAU/USD).
Best Timeframes for Gold Trading
Choosing the right timeframe is one of the most important parts of a successful TradingView Layout for Gold Traders. Each timeframe serves a different purpose, from identifying the overall market trend to finding precise trade entries. By combining multiple timeframes, you can make more informed trading decisions and avoid trading against the market direction.
Daily (1D) – Identify the Overall Trend
The Daily chart is where I begin my market analysis. It helps me understand the long-term trend and identify major support and resistance levels that can influence price movement. Before looking for any trade, I always check whether Gold is in an uptrend, downtrend, or ranging market.
Using the Daily chart in your TradingView Layout for Gold Traders gives you a broader perspective and helps you avoid trading against the dominant trend.
1-Hour (1H) – Analyse Market Structure
After identifying the overall trend, I move to the 1-hour chart to study the market structure. This timeframe allows me to spot higher highs, higher lows, lower highs, and lower lows while confirming whether the trend is still intact.
The 1-hour chart also helps me mark important breakout areas, trendlines, and key price zones before looking for an entry.
15-Minute (15M) – Execute Trades
The 15-minute chart is my preferred timeframe for entering trades. It provides enough detail to identify pullbacks, breakout confirmations, and candlestick patterns without the excessive market noise often found on lower timeframes.
In my TradingView Layout for Gold Traders, this is where I wait patiently for confirmation before placing a buy or sell order.
5-Minute (5M) – Entry Confirmation
Although I don’t base my entire analysis on the 5-minute chart, I use it to fine-tune my entries. It helps me confirm momentum, monitor price action, and reduce the size of my stop-loss when the setup aligns with the higher timeframes.
The 5-minute chart should support your analysis rather than replace it.
My Multi-Timeframe Workflow
Every trading day, I follow the same routine:
- Daily Chart: Identify the overall market trend and major support/resistance.
- 1-Hour Chart: Confirm the market structure and trend direction.
- 15-Minute Chart: Look for high-probability trade setups.
- 5-Minute Chart: Fine-tune the entry and manage risk.
Following this structured approach within my TradingView Layout for Gold Traders keeps my analysis consistent and prevents impulsive trading. By allowing the higher timeframes to guide my decisions and using the lower timeframes for precise entries, I can trade Gold with greater confidence and discipline.
Indicators I Use in My Gold Trading Setup
Over the years, I’ve experimented with many technical indicators, but I realised that using too many only creates confusion. Today, my TradingView Layout for Gold Traders includes just a handful of reliable indicators that complement price action rather than replace it. Each indicator has a specific purpose, helping me make more confident and disciplined trading decisions.
1. 20 EMA – Short-Term Trend Direction
The 20 Exponential Moving Average (EMA) is my primary trend indicator. It helps me identify the short-term market direction and dynamic support or resistance levels. When Gold is trading above the 20 EMA, I mainly look for buying opportunities. If the price is below it, I focus on potential sell setups.
The 20 EMA also helps me spot pullbacks within a strong trend, allowing me to enter trades with better timing.
2. 50 EMA – Trend Confirmation
I use the 50 EMA to confirm the overall trend. When both the 20 EMA and 50 EMA are aligned in the same direction, it increases my confidence in the trade. This simple combination helps filter out weak setups and keeps me trading with the prevailing market momentum.
Keeping these moving averages on my TradingView Layout for Gold Traders makes it easier to identify trend continuation opportunities.
3. RSI (Relative Strength Index) – Momentum Analysis
The Relative Strength Index (RSI) helps me measure market momentum and identify potential overbought or oversold conditions. However, I never rely on the RSI alone.
Instead, I use it as a confirmation tool alongside price action. For example, if Gold reaches a key support level and the RSI begins to recover from oversold conditions, it strengthens the case for a potential buying opportunity.
4. ATR (Average True Range) – Measuring Volatility
The Average True Range (ATR) is one of my favourite indicators because it measures market volatility instead of predicting direction.
I use the ATR to:
- Set realistic stop-loss levels.
- Understand whether the market is highly volatile or relatively calm.
- Avoid placing stop-losses that are too tight during volatile Gold sessions.
This helps me manage risk more effectively, especially when trading during the London and New York sessions.
5. Volume – Confirming Price Moves
Volume is an important part of my trading strategy because it shows the strength behind price movements.
When Gold breaks through a key support or resistance level with strong volume, the move is more likely to be genuine. On the other hand, a breakout with low volume may indicate a false move or a lack of market participation.
Volume helps me confirm whether buyers or sellers are truly in control before I enter a trade.
6. Support and Resistance Zones
Although not a traditional indicator, support and resistance zones are essential in my daily analysis. I manually mark these levels on my charts because they often act as turning points where price reacts.
Combining these key zones with moving averages and momentum indicators gives me a much clearer picture of the market.
Why I Keep My Setup Simple
One of the biggest mistakes new traders make is filling their charts with too many indicators. In my experience, simplicity leads to better decisions. My TradingView Layout for Gold Traders is designed to remove unnecessary distractions and keep my attention on price action, trend direction, and risk management.
By using only the 20 EMA, 50 EMA, RSI, ATR, Volume, and manually drawn support and resistance levels, I can analyse Gold efficiently without overcomplicating my trading process. This consistent setup has helped me stay disciplined and focus on high-quality trading opportunities rather than reacting to every market movement.
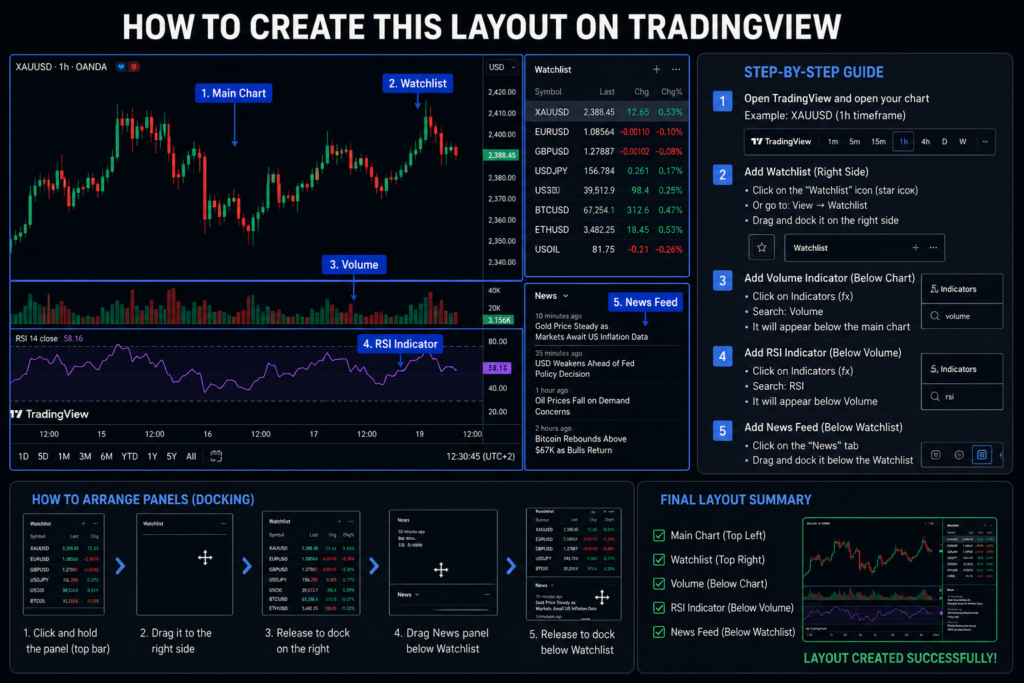
How to Create This Layout on TradingView
Creating a professional TradingView layout helps traders analyze charts faster, identify market trends, and make better trading decisions. A well-organized TradingView layout for gold traders can combine multiple timeframes, essential indicators, price action tools, and clean chart settings.
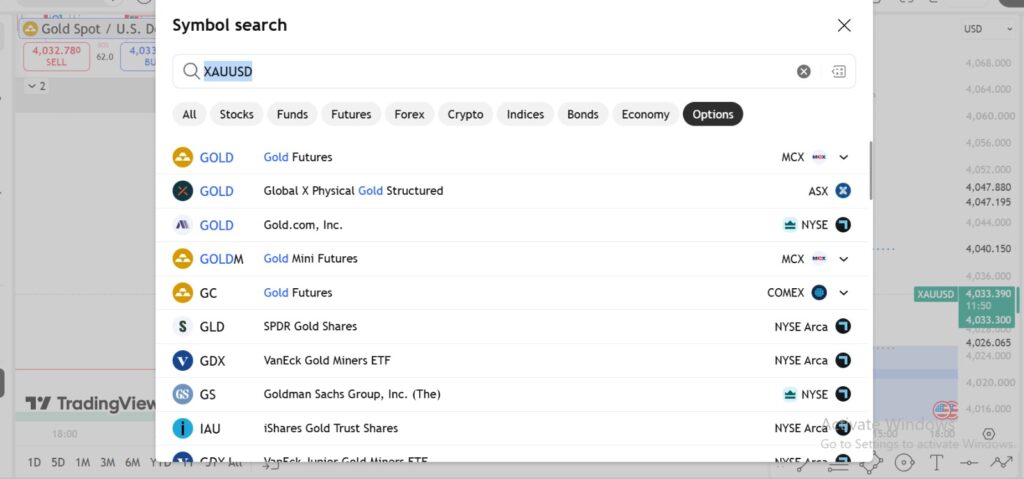
Step 1: Open TradingView and Select Your Market
First, open TradingView and choose the asset you want to analyze.
For gold trading:
- Open the TradingView chart.
- Search for XAU/USD (Gold vs US Dollar).
- Select the preferred gold instrument from your broker or data provider.
- Open the full-screen chart view.
Gold traders usually prefer XAU/USD because it provides high liquidity and strong price movement during major market sessions.
Follow these steps to build a similar trading setup.
:
Step 2: Choose the Right Chart Type
A clean chart makes technical analysis easier.
Recommended settings:
- Chart Type: Candlestick
- Theme: Dark mode (reduces eye strain)
- Background: Clean and simple
- Grid Lines: Reduce or remove unnecessary lines
To change the chart type:
Top toolbar → Chart Type → Candles
Candlestick charts help identify:
- Market structure
- Reversal patterns
- Breakouts
- Buyer and seller pressure
Step 3: Create Your Multi-Timeframe Layout
A professional gold trading layout often uses multiple timeframes.
Example setup:
Higher Timeframe Chart (Daily / 4H)
Purpose:
- Identify the overall trend
- Find major support and resistance
- Understand market direction
Trading Timeframe (1H / 15M)
Purpose:
- Find trading opportunities
- Confirm setups
- Analyze price action
Entry Timeframe (5M / 1M)
Purpose:
- Improve entry timing
- Reduce stop-loss distance
- Find precise setups
To create multiple charts:
- Click Select Layout in the top-right corner.
- Choose a multi-chart layout.
- Assign different timeframes to each chart.