Table of Contents
ToggleIntroduction
When I first started trading, I believed that the secret to becoming profitable was finding expensive premium indicators. Every time I watched a YouTube video or joined a trading community, someone was recommending a paid indicator that promised better entries and more accurate signals. I spent countless hours searching for the “perfect” indicator, thinking it would solve all my trading problems.
After months of trial and error, I realised something that completely changed my perspective. The indicators themselves weren’t the problem—it was how I was using them. Instead of chasing expensive tools, I decided to focus on learning the Best Free TradingView Indicators that were already available on the platform. To my surprise, many of these free indicators were more than enough to analyse the market effectively when combined with proper risk management and price action.
Over the years, I have tested dozens of indicators while trading Gold (XAU/USD), Forex, and other financial markets. Some were too complicated, some produced too many false signals, and others simply didn’t suit my trading style. Eventually, I narrowed my chart down to a handful of reliable tools that I now use almost every day. These Best Free TradingView Indicators have helped me identify trends, measure momentum, confirm trade setups, and improve my overall market analysis without spending money on premium scripts.
In this blog, I’m sharing my personal experience with the Best Free TradingView Indicators that have become an important part of my trading routine. This isn’t a list copied from the internet or based on theory alone. These are the indicators I have personally tested on live charts and continue to use because they help me make more informed trading decisions. While no indicator can guarantee profitable trades, choosing the right tools and understanding how to use them correctly can make your trading process much more structured and consistent.
If you’re a beginner looking for reliable indicators or an experienced trader wanting to simplify your chart setup, I hope my experience with these Best Free TradingView Indicators helps you find the tools that work best for your own trading journey.
Why I Use Free TradingView Indicators
When I first started trading, I believed that paid indicators were always better than free ones. I saw many traders promoting expensive scripts and premium tools, claiming they could predict the market with incredible accuracy. Like many beginners, I thought spending money on indicators would automatically improve my trading results. However, after trying different tools and gaining more experience, I realised that successful trading isn’t about using expensive indicators—it’s about understanding the market and using the right tools correctly.
Today, I rely on the Best Free TradingView Indicators because they provide everything I need for technical analysis without adding unnecessary complexity to my charts. Whether I’m analysing Gold (XAU/USD), Forex pairs, or other financial markets, these free indicators help me identify trends, measure momentum, confirm trade setups, and manage risk more effectively. They have become an essential part of my daily trading routine.
One of the reasons I prefer the Best Free TradingView Indicators is their simplicity. In the past, I overloaded my charts with multiple indicators, hoping that more signals would lead to better trades. Instead, my charts became confusing, and I often received conflicting signals that made decision-making even harder. Over time, I learned that keeping my chart clean and using only a few reliable indicators allowed me to focus more on price action and overall market structure.
Another reason I trust the Best Free TradingView Indicators is that they are widely used by traders around the world. Indicators like RSI, MACD, EMA, VWAP, Bollinger Bands, and ATR have been tested across different markets and timeframes for many years. Rather than constantly searching for the latest “secret indicator,” I prefer using proven tools that I fully understand and know how to combine with my trading strategy.
From my personal experience, I have also discovered that no indicator can predict the market perfectly. Every indicator has strengths and weaknesses, which is why I never rely on one indicator alone. Instead, I use the Best Free TradingView Indicators as confirmation tools alongside support and resistance levels, market structure, and proper risk management. This approach has helped me become more disciplined and make better trading decisions.
Looking back, choosing to focus on the Best Free TradingView Indicators instead of chasing expensive premium tools was one of the best decisions I made as a trader. It saved me money, simplified my chart analysis, and taught me that consistent success comes from knowledge, practice, and discipline—not from buying costly indicators. I hope sharing my experience encourages you to master the free tools available on TradingView before considering any paid alternatives.
What Makes a Good Trading Indicator?
When I first began trading, I judged an indicator by one simple question: “Does it give accurate buy and sell signals?” If it looked impressive or generated a lot of signals, I assumed it was a good indicator. After months of trading, I realised that this mindset was completely wrong. No indicator can predict the market with 100% accuracy, and expecting one to do so often leads to disappointment.
As I gained more experience, I learned that the Best Free TradingView Indicators are not the ones that promise perfect entries. Instead, they are the indicators that provide reliable information and help you make better trading decisions. A good indicator should support your analysis, not replace it.
1. It Should Be Easy to Understand
The best indicators are simple and straightforward. If an indicator is filled with dozens of lines, colours, and signals that you can’t explain, it’s probably making your analysis more complicated than it needs to be. The Best Free TradingView Indicators are effective because they present market information in a clear and easy-to-understand way.
2. It Should Match Your Trading Strategy
Every trader has a different style. Some prefer trend trading, while others focus on scalping or swing trading. A good indicator should complement your strategy instead of forcing you to change it. For example, I use EMA to identify trends, RSI to measure momentum, and ATR to understand market volatility because they fit the way I trade.
3. It Should Help Confirm Your Analysis
One of the biggest lessons I’ve learned is that indicators should confirm a trade idea, not create it. Before entering a trade, I first analyse market structure, support and resistance levels, and price action. Then I use the Best Free TradingView Indicators to confirm whether my analysis aligns with the current market conditions. This approach has helped me avoid many low-quality trades.
4. It Should Work Across Different Market Conditions
A reliable indicator should perform consistently across different markets and timeframes. Whether I’m analysing Gold (XAU/USD), Forex pairs, or indices, I prefer indicators that provide useful information regardless of the asset I’m trading. That’s one of the reasons I continue to rely on the Best Free TradingView Indicators rather than constantly switching to new or untested tools.
5. It Should Keep Your Charts Clean
One mistake I made as a beginner was adding too many indicators to a single chart. Instead of helping me, they created confusion because different indicators often gave conflicting signals. Over time, I realised that a clean chart with two or three well-chosen indicators is far more effective than a chart overloaded with technical tools. The Best Free TradingView Indicators provide valuable insights without making your analysis unnecessarily complex.
My Personal Experience
Looking back, I now understand that a good trading indicator isn’t one that predicts every market move—it’s one that helps you analyse the market with greater confidence and discipline. The Best Free TradingView Indicators I use today have earned their place on my charts because they consistently provide useful information, not because they promise guaranteed profits.
If there’s one piece of advice I would give to new traders, it’s this: don’t spend your time searching for the “perfect” indicator. Instead, choose a few reliable tools, learn how they work, and use them alongside sound risk management and price action. From my experience, mastering a handful of the Best Free TradingView Indicators is far more valuable than constantly chasing the next popular indicator.
Best Free TradingView Indicators
Relative Strength Index (RSI)
The Relative Strength Index, commonly known as RSI, is a momentum indicator that measures the speed and strength of price movements. It ranges from 0 to 100 and helps traders identify whether an asset may be overbought or oversold.
Generally:
- Above 70 – The market may be overbought.
- Below 30 – The market may be oversold.
- Around 50 – Indicates neutral momentum.
Although these levels are useful, I don’t rely on them alone when making trading decisions.
How I Use RSI in My Trading
Over time, I developed a simple approach to using RSI:
- First, I identify the overall market trend.
- Next, I mark important support and resistance levels.
- Then, I use RSI to confirm whether momentum supports my trading idea.
- Finally, I wait for a clear price action signal before entering a trade.
This process keeps me patient and prevents me from relying solely on indicator signals.
Best RSI Settings
For most markets, I use the default RSI settings:
- Period: 14
- Overbought Level: 70
- Oversold Level: 30
These settings have worked well for me when trading Gold (XAU/USD) and major Forex pairs. While some traders customise these values, I have found that the default settings provide consistent results across different timeframes.

2. MACD
Another indicator that has earned a permanent place on my charts is the Moving Average Convergence Divergence (MACD). Among all the Best Free TradingView Indicators, MACD is one that I use to understand market momentum and identify potential trend changes. While I don’t rely on it for generating buy or sell signals on its own, it provides valuable confirmation before I enter a trade.
When I first started using MACD, I made the mistake of taking every crossover as a trading signal. I quickly learned that not every crossover leads to a profitable trade. After spending more time analysing charts, I realised that MACD works best when it confirms what price action is already telling me.
What Is MACD?
The Moving Average Convergence Divergence (MACD) is a momentum and trend-following indicator that shows the relationship between two moving averages. It helps traders identify:
- Trend direction
- Momentum strength
- Potential trend reversals
- Bullish and bearish crossovers
The MACD consists of three main components:
- MACD Line
- Signal Line
- Histogram
Together, these components provide a clear picture of whether market momentum is strengthening or weakening.
Best MACD Settings
For most of my trading, I use TradingView’s default MACD settings:
- Fast EMA: 12
- Slow EMA: 26
- Signal Line: 9
These settings have worked well for me across Gold (XAU/USD), Forex pairs, and other major markets. Instead of constantly changing the settings, I prefer to understand how the default configuration behaves under different market conditions.

Bollinger Bands
What Are Bollinger Bands?
Bollinger Bands are a volatility indicator that consists of three lines:
- Upper Band
- Middle Band (20-period Simple Moving Average)
- Lower Band
The bands automatically expand when market volatility increases and contract when volatility decreases. This makes them an excellent tool for understanding the current market environment.
Why Bollinger Bands Are One of the Best Free TradingView Indicators
One of the reasons I consider Bollinger Bands one of the Best Free TradingView Indicators is because they help me avoid trading during quiet market conditions. When the bands become very narrow, it usually tells me that volatility is low and the market is consolidating. Instead of forcing trades, I stay patient and wait for a breakout.
On the other hand, when the bands begin to widen, it often indicates that volatility is increasing and a stronger price movement may be underway. This helps me prepare for potential trading opportunities rather than reacting after the move has already happened.
How I Use Bollinger Bands in My Trading
My approach to using Bollinger Bands is simple:
- I first determine the overall market trend.
- Then I identify important support and resistance levels.
- Next, I observe how price behaves around the Bollinger Bands.
- If the bands are narrowing, I prepare for a possible breakout.
- If the bands are expanding, I look for trading opportunities that align with the market trend.
- Finally, I confirm my trade using price action before entering the market.
This method has helped me avoid many unnecessary trades and improved my patience.
Volume Weighted Average Price
One of the Best Free TradingView Indicators that has become an important part of my intraday trading is the Volume Weighted Average Price (VWAP). I discovered VWAP while learning how professional and institutional traders analyse the market. At first, I didn’t fully understand how it worked, so I ignored it and continued relying on moving averages. However, after spending time testing it on Gold (XAU/USD), I realised that VWAP provides a completely different perspective on price action.
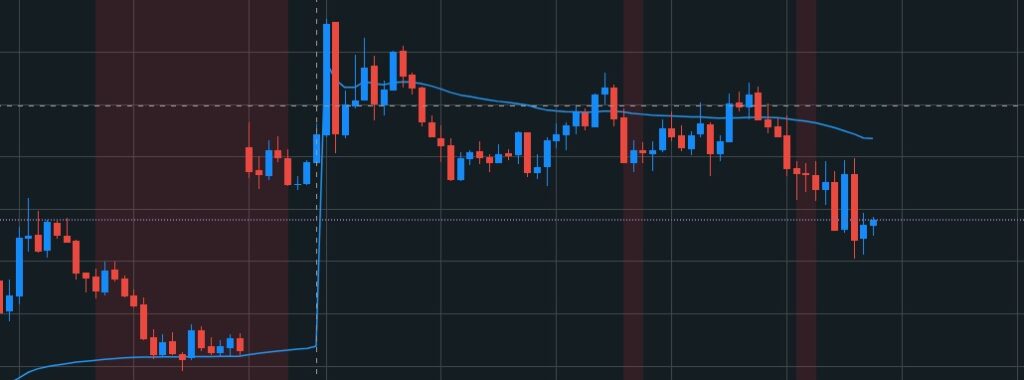
Unlike traditional moving averages, VWAP takes both price and trading volume into account. This makes it a powerful tool for understanding where the average traded price is during the current trading session.
What Is VWAP?
The Volume Weighted Average Price (VWAP) is an intraday indicator that calculates the average price of an asset based on both its price and trading volume. Since volume is included in the calculation, VWAP provides a more accurate representation of the market’s average traded price than a simple moving average.
Many professional traders and institutions use VWAP as a benchmark to determine whether the current price is trading above or below the average value for the day.
Why VWAP Is One of the Best Free TradingView Indicators
One of the reasons I consider VWAP one of the Best Free TradingView Indicators is because it helps me understand the overall market bias during the trading session.
In my experience:
- When the price remains above VWAP, buyers are generally in control, and I mainly look for buying opportunities.
- When the price stays below VWAP, sellers usually have the advantage, and I become more interested in sell setups.
Rather than taking trades in every direction, VWAP helps me stay aligned with the market’s momentum.
Average True Range (ATR)
The Average True Range (ATR) is one of the Best Free TradingView Indicators that completely changed the way I manage risk. When I first started trading, I was obsessed with finding the perfect entry point. I would spend hours analysing charts, but I rarely paid attention to market volatility. As a result, I often placed my stop loss too close to the current price, and many of my trades were stopped out before the market moved in my favour.
Everything changed when I started using ATR. Instead of guessing where to place my stop loss, I began using ATR to measure the market’s normal price movement. This simple adjustment helped me avoid unnecessary losses and made my trading much more consistent.
What Is the Average True Range (ATR)?
The Average True Range (ATR) is a volatility indicator developed by J. Welles Wilder. Unlike indicators that predict the direction of the market, ATR measures how much an asset typically moves over a specific period.
A higher ATR value means the market is more volatile, while a lower ATR value indicates quieter market conditions. This makes ATR an excellent tool for setting realistic stop losses and understanding whether the market is likely to experience large or small price swings.