What Is Price Action Trading?
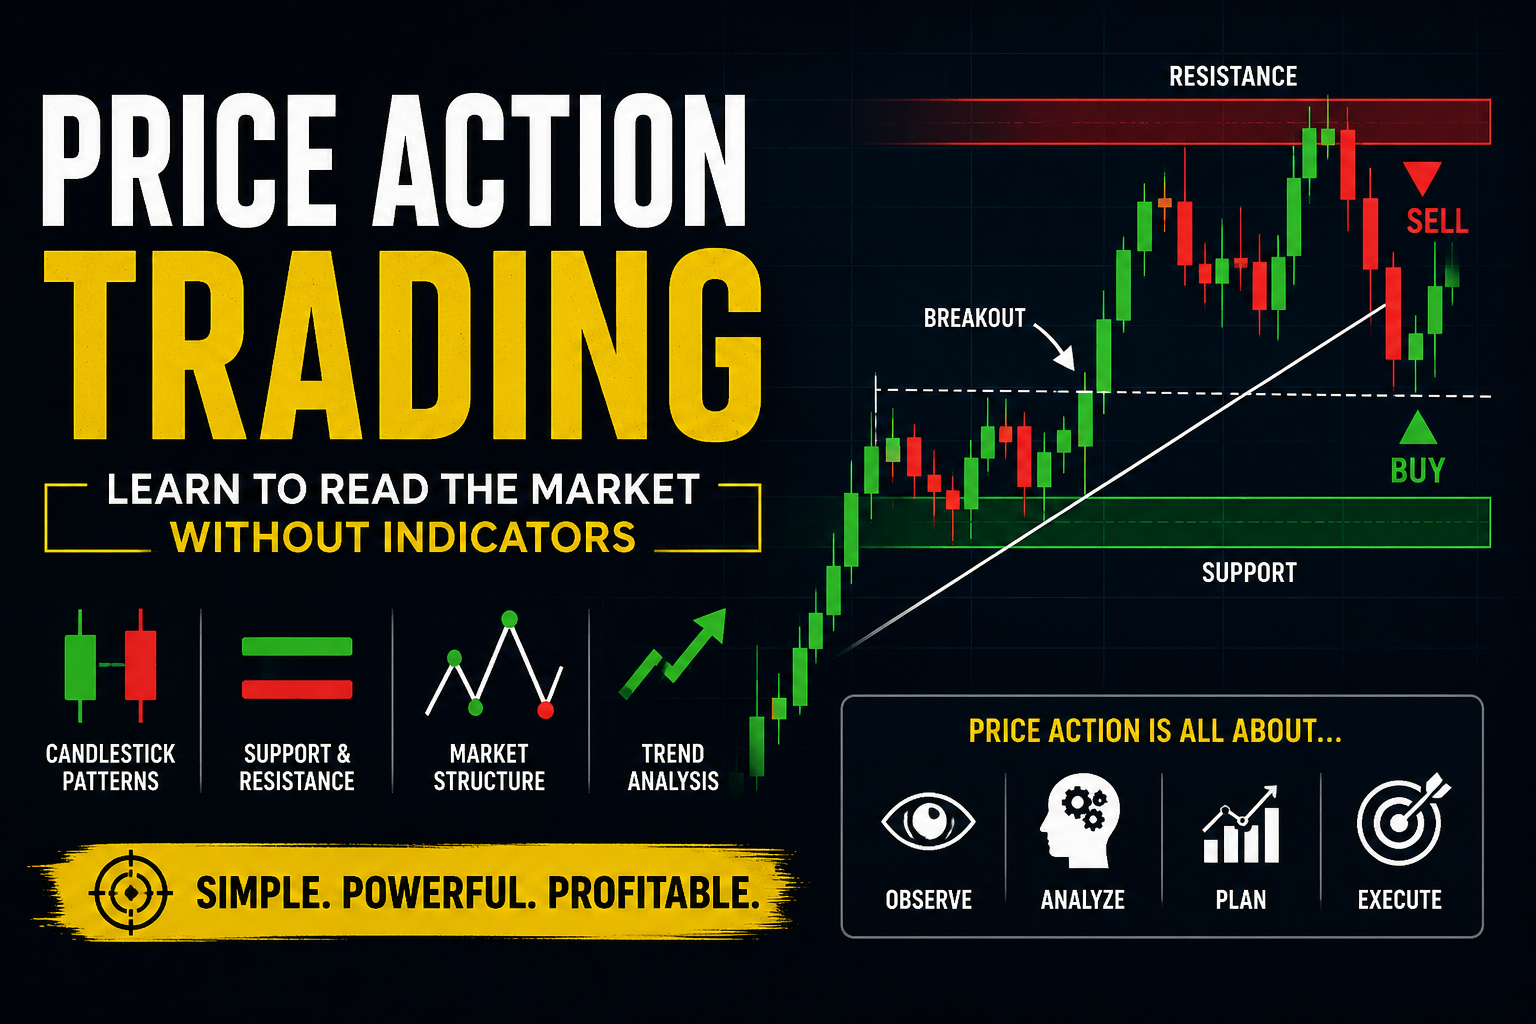
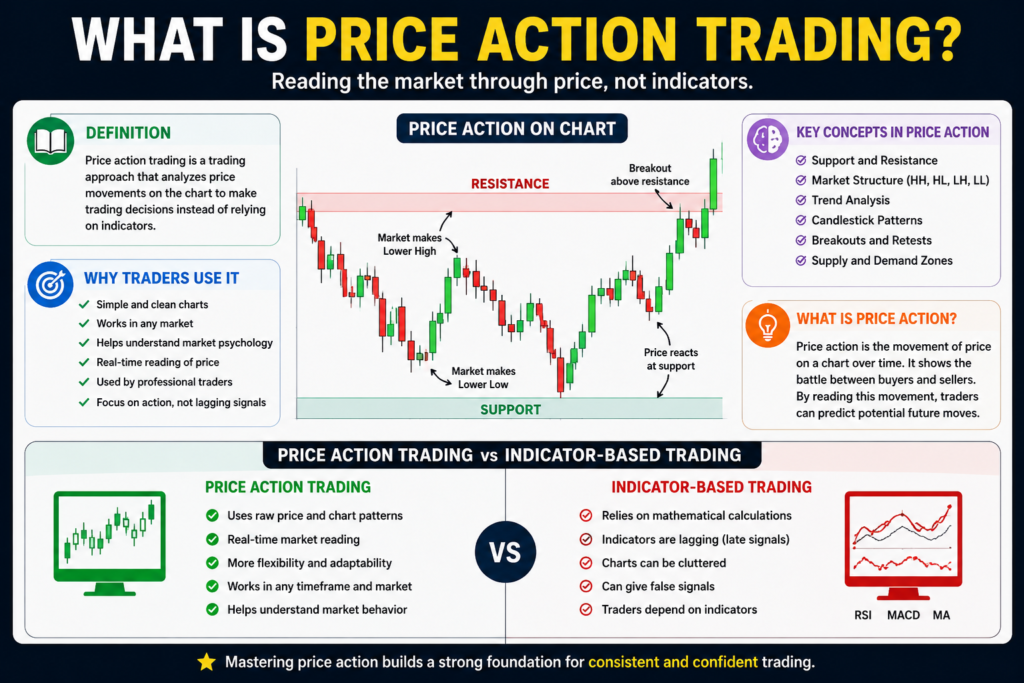
Price action trading is a trading approach that focuses on analyzing the movement of an asset’s price instead of relying on technical indicators. Rather than using tools like moving averages, RSI, or MACD, traders study price charts, candlestick patterns, support and resistance levels, and market structure to make trading decisions. The idea is simple: the price reflects all available information, so by learning to read price movements, traders can better understand market sentiment and identify high-probability trading opportunities.
In simple terms, price action trading means learning to “read the story” that the market is telling through its price movements. Every candle on a chart represents the ongoing battle between buyers and sellers. When buyers are stronger, prices rise, creating bullish trends. When sellers dominate, prices fall, leading to bearish trends. By recognizing these patterns, traders can make informed decisions without cluttering their charts with multiple indicators.
One of the main reasons traders choose price action trading is its simplicity and flexibility. Since it relies on raw market data, it can be applied to almost any financial market, including Forex, gold (XAU/USD), stocks, cryptocurrencies, commodities, and indices. Many professional traders prefer this approach because it helps them focus on the market’s behavior rather than waiting for lagging indicators to generate signals. It also encourages traders to develop a deeper understanding of market psychology, making it easier to identify trends, reversals, and breakout opportunities.
A common question beginners ask is, “What is price action?” Simply put, price action is the movement of an asset’s price over time. Every rise, fall, and period of consolidation forms patterns that traders can analyze to predict potential future movements. These patterns include candlestick formations, swing highs and lows, trend lines, and key support and resistance zones. Understanding these concepts is the foundation of becoming a successful price action trading practitioner.
Price Action vs. Indicator-Based Trading
The biggest difference between price action trading and indicator-based trading is the source of information used to make decisions.
In indicator-based trading, traders rely on mathematical calculations derived from past price data. Popular indicators such as the Relative Strength Index (RSI), Moving Average Convergence Divergence (MACD), and moving averages can help confirm trends, but they often react after the price has already moved. This delay can cause traders to enter or exit positions later than desired.
In contrast, price action trading focuses directly on the price chart itself. Instead of waiting for an indicator to signal a trade, traders analyze live price movements, candlestick patterns, market structure, and support and resistance levels. This allows them to respond more quickly to changing market conditions and develop a clearer understanding of buyer and seller behavior.
While indicators can be useful as supporting tools, many experienced traders believe that mastering price action provides a stronger foundation for consistent trading. By understanding how price behaves around key market levels, traders can make more confident decisions and avoid relying solely on lagging signals.
Ultimately, whether you trade Forex, gold, stocks, or cryptocurrencies, learning price action is one of the most valuable skills you can develop. It helps you interpret the market more effectively, improve your timing, and build a trading strategy based on how the market actually moves rather than on delayed calculations.
2. Why Price Action Is So Popular
Over the years, price action trading has become one of the most trusted trading methods among beginners and professional traders alike. Instead of relying on complex indicators, this approach focuses on understanding how the market moves through price itself. Because of its simplicity, flexibility, and effectiveness, millions of traders use price action to analyze Forex, gold, stocks, cryptocurrencies, and other financial markets.
Clean and Easy-to-Read Charts
One of the biggest reasons traders prefer price action trading is the clean appearance of the charts. Many traders fill their screens with multiple indicators, making it difficult to identify quality trading opportunities. Price action traders remove unnecessary tools and focus on candlesticks, support and resistance levels, trend lines, and market structure.
A clean chart allows traders to:
- Spot trends more easily.
- Identify key support and resistance zones.
- Reduce confusion caused by conflicting indicators.
No Lagging Indicators
Traditional technical indicators such as moving averages, RSI, and MACD are based on historical price data. This means they often generate signals after the market has already moved, causing traders to enter or exit trades later than expected.
In contrast, price action trading focuses on real-time market behavior. Instead of waiting for an indicator to confirm a trend, traders analyze live price movements and candlestick patterns to identify potential opportunities as they develop. This can lead to better trade timing and a more responsive trading strategy.
A Better Understanding of Market Psychology
Every price movement reflects the ongoing battle between buyers and sellers. One of the greatest strengths of price action trading is that it helps traders understand the psychology behind these movements.
For example:
- A strong bullish candle shows buyers are in control.
- A long upper wick may indicate sellers are rejecting higher prices.
- A breakout above resistance suggests increasing buying pressure.
- A sharp reversal can signal a shift in market sentiment.
Used by Professional Traders
Many experienced traders and institutional market participants rely on price action because it provides a direct view of the market. Rather than depending on dozens of indicators, professionals often base their decisions on market structure, support and resistance, supply and demand zones, and candlestick formations.
This doesn’t mean professionals never use indicators. Instead, they often use indicators as supporting tools while allowing price action to remain the primary basis for their analysis. This balanced approach helps them make more informed trading decisions.
Works Across Every Financial Market
Another reason for the growing popularity of price action trading is its versatility. The same principles can be applied to almost every financial market, making it a valuable skill regardless of what you trade.
You can use price action to trade:
- Forex currency pairs such as EUR/USD and GBP/USD.
- Gold (XAU/USD) by analyzing key support, resistance, and trend movements.
- Cryptocurrencies like Bitcoin and Ethereum.
- Stocks using daily and intraday price patterns.
- Indices such as the S&P 500, NASDAQ, and other major stock market indexes.
Why So Many Traders Choose Price Action
The popularity of price action trading comes down to one simple fact: it helps traders understand what the market is doing without unnecessary complexity. Clean charts, real-time analysis, deeper insight into market psychology, widespread use by professional traders, and the ability to trade any market make price action one of the most effective and timeless trading approaches available today.
3. How Price Action Works
Understanding how price action trading works is the foundation of becoming a confident trader. Instead of relying on multiple indicators, traders analyze the movement of price itself to understand who is controlling the market and where the next opportunity may appear. Every candle, breakout, pullback, and trend tells a story about the ongoing battle between buyers and sellers.
Buyers vs. Sellers: The Battle That Moves the Market
At its core, the financial market is driven by two groups: buyers (bulls) and sellers (bears). Every price movement happens because one side temporarily gains more strength than the other.
When buyers are more aggressive, demand increases and prices move higher. On the other hand, when sellers dominate, supply increases and prices fall. This continuous struggle creates the candlestick patterns and trends that traders see on their charts.
In price action trading, you don’t need an indicator to tell you who is winning. Instead, you observe the size of candles, their closing positions, and how price reacts at important levels. Large bullish candles often signal strong buying pressure, while large bearish candles indicate strong selling pressure.
Supply and Demand: The Real Driver of Price
Supply and demand are the forces behind every market move.
- Demand zones are areas where buyers enter aggressively, pushing prices upward.
- Supply zones are areas where sellers become active, causing prices to reverse or decline.
When demand exceeds supply, prices rise because buyers are willing to pay higher prices. When supply exceeds demand, prices fall as sellers compete to sell at lower prices.
Successful traders using price action trading focus on identifying these zones instead of depending solely on technical indicators. Watching how price reacts when it reaches a supply or demand area can provide valuable clues about the market’s next move.
Market Structure: Reading the Market’s Story
Market structure refers to the pattern of highs and lows that price creates over time. It helps traders understand whether the market is moving upward, downward, or sideways.
There are three basic market structures:
- Uptrend: Higher highs and higher lows.
- Downtrend: Lower highs and lower lows.
- Range: Price moves between support and resistance without a clear direction.
Learning to identify market structure is one of the most important skills in price action trading. Before entering any trade, experienced traders first determine the current market structure because trading with the trend generally offers higher-probability opportunities than trading against it.
Trend Formation: How Trends Develop
A trend doesn’t begin randomly. It develops when one side consistently overpowers the other.
An uptrend forms when buyers continue making higher highs and higher lows, showing confidence in pushing prices upward. A downtrend develops when sellers repeatedly create lower highs and lower lows, demonstrating strong selling pressure.
However, no trend lasts forever. Trends often experience pullbacks before continuing or eventually reversing. By studying price movements instead of lagging indicators, traders can often recognize these changes earlier.
Momentum: Measuring the Strength Behind the Move
Momentum tells traders how strong or weak a price movement is. Strong momentum is usually represented by large candles, consecutive moves in one direction, and little hesitation from the market.
Signs of strong momentum include:
- Large bullish or bearish candlesticks.
- Quick breakouts above resistance or below support.
- Very small pullbacks during a trend.
- High conviction from buyers or sellers.
4. Understanding Candlesticks
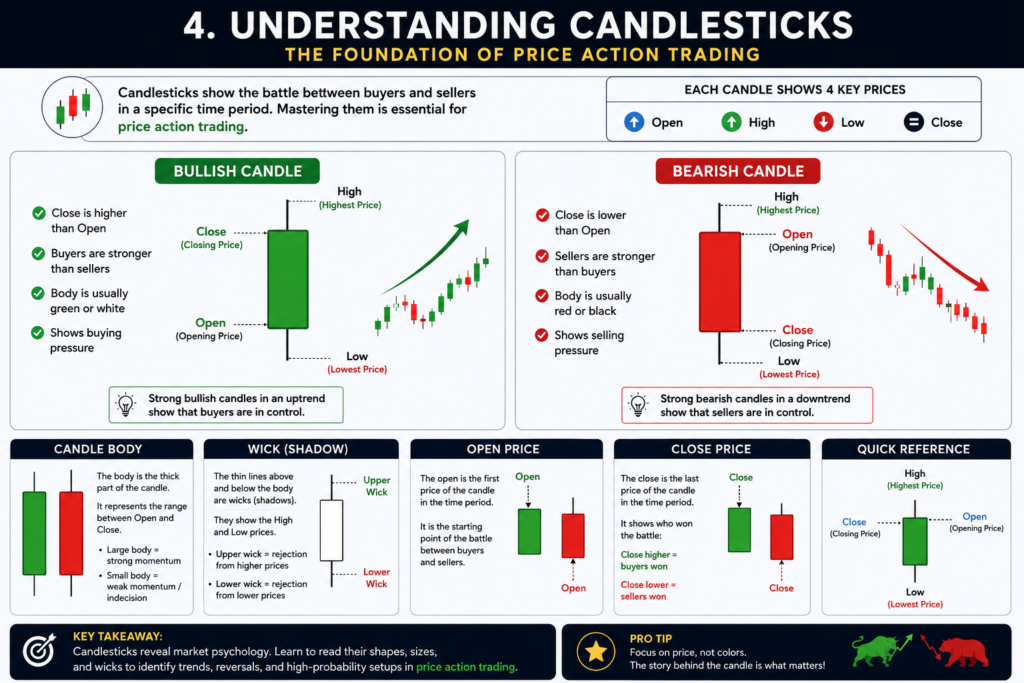
Candlesticks are the language of the financial markets. If you want to master price action trading, learning how to read candlesticks is one of the most important skills you can develop. Every candlestick tells a story about the battle between buyers and sellers during a specific period, helping traders make informed decisions without relying heavily on indicators.
By understanding candlestick components, you can identify market sentiment, trend strength, and potential reversal points with greater confidence.
What Is a Candlestick?
A candlestick is a visual representation of price movement over a selected time frame, such as one minute, one hour, or one day. Each candlestick displays four key pieces of information:
- Open price
- High price
- Low price
- Close price
Together, these four prices reveal how the market behaved during that trading session. This is why price action trading focuses heavily on candlestick analysis instead of lagging technical indicators.
Bullish Candle
A bullish candle forms when the closing price is higher than the opening price. It shows that buyers were stronger than sellers during that period.
Characteristics of a bullish candle include:
- The close is above the open.
- The candle body is usually green or white, depending on the trading platform.
- It signals buying pressure and positive market sentiment.
Bearish Candle
A bearish candle forms when the closing price is lower than the opening price. This indicates that sellers dominated the trading session.
Characteristics of a bearish candle include:
- The close is below the open.
- The candle body is usually red or black.
- It reflects selling pressure and negative market sentiment.
Multiple bearish candles appearing one after another often suggest that sellers are controlling the market. Traders using price action trading pay close attention to bearish candles near resistance levels because they may signal the beginning of a downward move.
Candle Body
The candle body is the thick rectangular portion of the candlestick. It represents the difference between the opening and closing prices.
The size of the body provides valuable information:
- A large body indicates strong buying or selling pressure.
- A small body suggests market indecision or weak momentum.
Large bullish bodies often signal aggressive buying, while large bearish bodies show strong selling activity. By analyzing candle body size, traders can better understand market strength and make more confident trading decisions.
Wick (Shadow)
The thin lines extending above and below the candle body are called wicks, also known as shadows.
The upper wick represents the highest price reached during the trading period, while the lower wick shows the lowest price.
Long wicks reveal that price was rejected before the candle closed.
For example:
- A long upper wick suggests sellers pushed the price down after buyers initially drove it higher.
- A long lower wick indicates buyers stepped in after sellers pushed prices lower.
Open Price
The open price is the first price at which an asset trades during a new candle’s time period.
It serves as the starting point for the candlestick. Comparing the opening price with the closing price helps traders determine whether buyers or sellers controlled that session.
For example:
- If the market opens low and closes much higher, buyers clearly dominated.
- If the market opens high but closes lower, sellers gained control.
Why Candlesticks Matter in Price Action Trading
Candlesticks provide instant insight into market psychology. Instead of depending on delayed indicators, traders can read the story of the market directly from price movement. By learning to interpret bullish and bearish candles, candle bodies, wicks, and opening prices, you can recognize trend strength, spot reversals earlier, and make higher-quality trading decisions. This is why candlestick analysis remains one of the core foundations of successful price action trading.
5. Trend Analysis
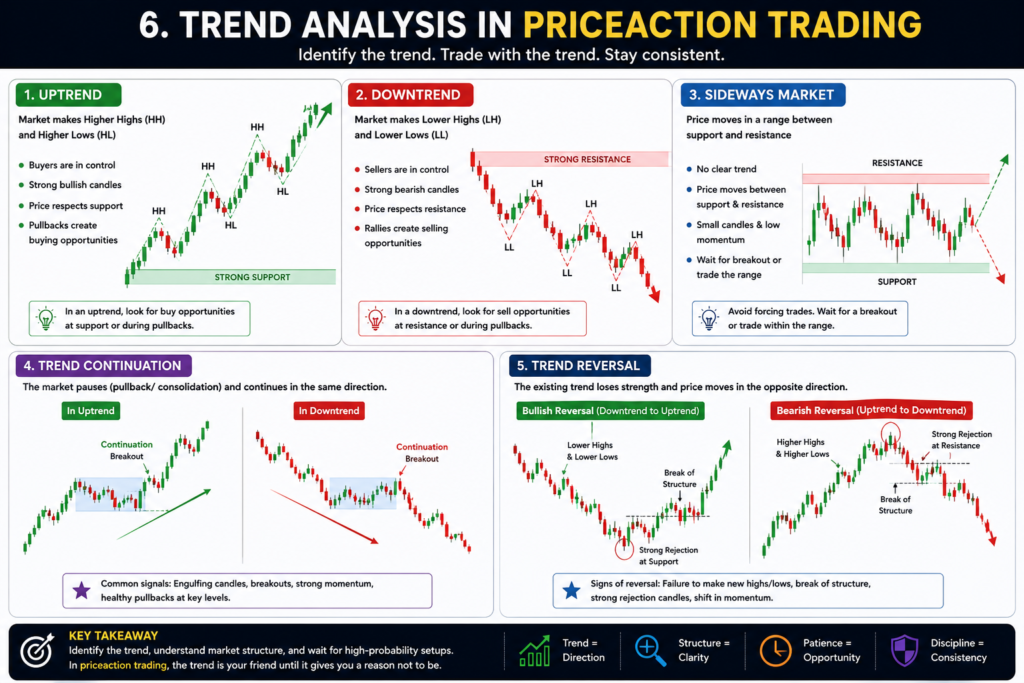
Trend analysis is one of the most important skills every trader should master. In price action trading, identifying the market’s trend helps traders make better decisions by trading with the overall direction instead of fighting against it. A trend shows whether buyers or sellers are in control and can significantly improve the probability of successful trades.
By learning to recognize uptrends, downtrends, sideways markets, trend continuations, and reversals, you can better understand market behavior and avoid unnecessary losses.
Uptrend
An uptrend occurs when the market consistently makes higher highs (HH) and higher lows (HL). This indicates that buyers are stronger than sellers and continue pushing prices upward.
Characteristics of an uptrend include:
- Higher highs and higher lows.
- Strong bullish candles.
- Price often respects support levels.
- Pullbacks are followed by new buying pressure.
Downtrend
A downtrend is the opposite of an uptrend. It forms when the market creates lower highs (LH) and lower lows (LL), showing that sellers are controlling price movement.
Common characteristics include:
- Lower highs and lower lows.
- Strong bearish candles.
- Resistance levels repeatedly reject price.
- Short rallies are followed by renewed selling.
Sideways Market
Not every market trends. Sometimes price moves within a defined range without creating higher highs or lower lows. This is known as a sideways market or ranging market.
Signs of a sideways market include:
- Price repeatedly bounces between support and resistance.
- Small candlesticks with overlapping price action.
- Low momentum.
- Frequent false breakouts.
Trend Continuation
A trend continuation occurs when the market pauses briefly through a pullback or consolidation before continuing in its original direction.
For example:
- During an uptrend, price may pull back to a support level before making another higher high.
- During a downtrend, price may rally temporarily to resistance before continuing lower.
Common continuation signals include:
- Bullish or bearish engulfing candles.
- Breakouts from consolidation patterns.
Trend Reversal
A trend reversal happens when the existing trend loses strength and the market begins moving in the opposite direction.
A bullish reversal changes a downtrend into an uptrend, while a bearish reversal changes an uptrend into a downtrend.
Signs of a possible trend reversal include:
- Failure to create new highs or new lows.
- Break of market structure.
- Strong rejection candles with long wicks.
Why Trend Analysis Matters in Price Action Trading
Trend analysis helps traders understand the overall direction of the market before placing a trade. Rather than guessing where price will go next, price action trading encourages traders to read market structure, identify the dominant trend, and wait for high-probability setups. Whether the market is trending upward, downward, or moving sideways, understanding trend behavior allows traders to make more disciplined decisions, reduce emotional trading, and improve long-term consistency.
6. Price Action Chart Patterns
Chart patterns are among the most powerful tools in price action trading because they help traders identify potential trend reversals, continuations, and breakout opportunities without relying on indicators. These patterns are formed by the natural movement of price and reflect the psychology of buyers and sellers.
By learning to recognize these patterns, traders can improve their market timing and make more informed trading decisions. Below are four of the most reliable chart patterns every trader should know.
Double Top
A Double Top is a bearish reversal pattern that forms after a strong uptrend. It appears when price reaches a resistance level twice but fails to break above it.
The pattern resembles the letter “M” and signals that buyers are losing strength while sellers are beginning to take control.
Characteristics of a Double Top
- Forms after an uptrend.
- Two peaks occur at approximately the same price level.
- A neckline forms between the two peaks.
- A bearish breakout below the neckline confirms the pattern.
Trading the Double Top
In price action trading, traders usually wait for the price to close below the neckline before entering a sell trade. This confirmation helps reduce the risk of false signals.
A stop-loss is often placed above the second peak, while the profit target can be estimated by measuring the height of the pattern and projecting it downward.
Double Bottom
A Double Bottom is the opposite of a Double Top. It is a bullish reversal pattern that forms after a downtrend.
The pattern looks like the letter “W” and indicates that sellers attempted to push prices lower twice but failed, allowing buyers to regain control.
Characteristics of a Double Bottom
- Forms after a downtrend.
- Two lows appear near the same support level.
- A neckline develops between the two bottoms.
Trading the Double Bottom
In price action trading, traders typically wait for a strong bullish candle to close above the neckline before entering a buy position.
The stop-loss is commonly placed below the second bottom, while the profit target is often equal to the height of the pattern projected upward.
Head and Shoulders
The Head and Shoulders pattern is one of the most reliable bearish reversal patterns in technical analysis.
It develops after an uptrend and consists of three peaks:
- Left Shoulder
- Head (the highest peak)
- Right Shoulder
A neckline connects the two swing lows between these peaks.
Characteristics of the Head and Shoulders Pattern
- Appears after an established uptrend.
- The head is higher than both shoulders.
- The shoulders are roughly equal in height.
- A break below the neckline confirms the reversal.
Trading the Head and Shoulders Pattern
Traders using price action trading usually wait for a confirmed breakout below the neckline before opening a sell trade.
Volume often increases during the breakout, adding confidence that the trend is changing from bullish to bearish.
Inverse Head and Shoulders
The Inverse Head and Shoulders pattern is a bullish reversal pattern that forms after a prolonged downtrend.
It is simply an upside-down version of the standard Head and Shoulders pattern and signals that buyers are gradually taking control of the market.
The pattern consists of:
- Left Shoulder
- Head (the lowest point)
- Right Shoulder
Characteristics of the Inverse Head and Shoulders
- Forms after a downtrend.
- The head is lower than both shoulders.
- The shoulders are approximately equal.
- A breakout above the neckline confirms the bullish reversal.
Tips for Trading Price Action Chart Patterns
Simply recognizing a chart pattern is not enough. Professional traders always look for confirmation before entering a trade.
Some useful confirmation signals include:
- Strong bullish or bearish candlesticks.
- Increased trading volume during the breakout.
- Break and close beyond the neckline.
- Confluence with support or resistance levels.
- Alignment with the overall market trend.
Frequently Asked Questions
1. Is Price Action Better Than Indicators?
There is no single “best” trading method because every trader has different goals and preferences. However, price action trading offers several advantages over relying solely on indicators.
Price action focuses on reading raw market movements through candlesticks, market structure, and support and resistance levels. Since indicators are usually based on historical price data, they often react after the market has already moved.
2. Can Beginners Learn Price Action?
Yes. Beginners can absolutely learn price action trading, although it requires patience and consistent practice.
Start by learning the basics:
- Candlestick patterns
- Support and resistance
- Trend analysis
- Market structure
- Risk management
3. Which Timeframe Is Best for Price Action?
There is no perfect timeframe for every trader.
The best timeframe depends on your trading style:
- 1-Minute to 5-Minute Charts: Scalping
- 15-Minute to 1-Hour Charts: Day trading
- 4-Hour Charts: Swing trading
- Daily Charts: Position trading and long-term investing
4. Is Price Action Profitable?
Yes, price action trading can be profitable when combined with proper risk management, discipline, and a well-tested trading strategy.
However, no strategy guarantees profits on every trade. Even professional traders experience losing trades.
Long-term profitability depends on:
- Consistent execution
- Proper position sizing
- Risk-to-reward management
- Emotional control
- Following a trading plan
5. Does Price Action Work in Gold?
Yes. Gold is one of the most popular markets for price action trading because it often produces strong trends, clear support and resistance levels, and highly visible chart patterns.
Many Gold traders rely on price action to identify:
- Trend reversals
- Breakouts
- Pullbacks
- Rejection candles
- Supply and demand zones
There is no single “best” trading method because every trader has different goals and preferences. However, price action trading offers several advantages over relying solely on indicators.
Price action focuses on reading raw market movements through candlesticks, market structure, and support and resistance levels. Since indicators are usually based on historical price data, they often react after the market has already moved.
Yes. Beginners can absolutely learn price action trading, although it requires patience and consistent practice.
Start by learning the basics:
- Candlestick patterns
- Support and resistance
- Trend analysis
- Market structure
- Risk management
There is no perfect timeframe for every trader.
The best timeframe depends on your trading style:
- 1-Minute to 5-Minute Charts: Scalping
- 15-Minute to 1-Hour Charts: Day trading
- 4-Hour Charts: Swing trading
- Daily Charts: Position trading and long-term investing
Yes, price action trading can be profitable when combined with proper risk management, discipline, and a well-tested trading strategy.
However, no strategy guarantees profits on every trade. Even professional traders experience losing trades.
Long-term profitability depends on:
- Consistent execution
- Proper position sizing
- Risk-to-reward management
- Emotional control
- Following a trading plan
Yes. Gold is one of the most popular markets for price action trading because it often produces strong trends, clear support and resistance levels, and highly visible chart patterns.
Many Gold traders rely on price action to identify:
- Trend reversals
- Breakouts
- Pullbacks
- Rejection candles
- Supply and demand zones