Table of Contents
ToggleIntroduction
Crypto trading is not simply about watching whether the price is going up or down. The real challenge is understanding what is happening behind the price movement and whether a trend has enough strength to continue. This is where crypto trading indicators become useful. They can help traders study momentum, trends, volatility, and market activity before entering or exiting a trade.
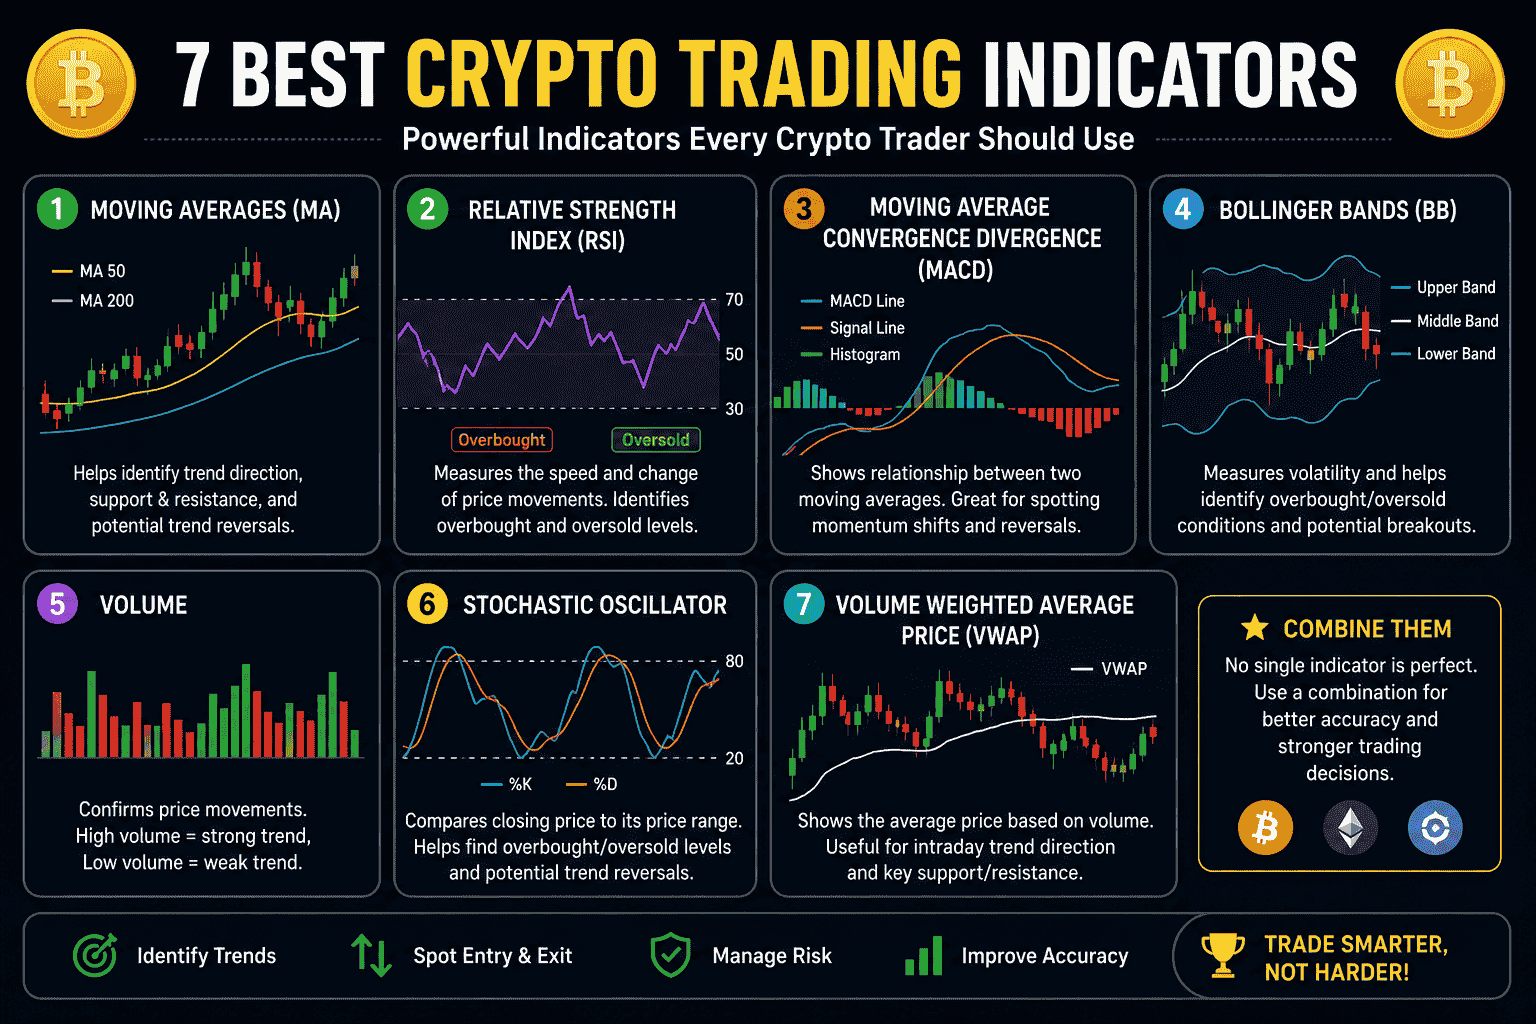
However, using too many indicators can make a chart confusing rather than helpful. The key is knowing which indicators provide useful information and how to apply them in the right market conditions. In this guide, we’ll explore 7 best crypto trading indicators, explain how each one works, and show where they can fit into a practical trading analysis.
What Are Crypto Trading Indicators?
A crypto chart can show you what price has already done, but indicators can help you examine the conditions behind that movement. They transform raw market data such as price and trading volume into signals that can make trends, momentum, volatility, and potential turning points easier to interpret.
What makes crypto trading indicators particularly useful is that different indicators answer different questions. A moving average can help determine whether the market is trending, RSI can show whether momentum is becoming stretched, while volume can reveal whether a price move is attracting meaningful participation.
But there is a common mistake among beginners: adding five or six indicators to one chart and treating every signal as a reason to trade. More indicators do not automatically mean better analysis. A cleaner approach is to give each tool a specific job and look for confirmation between price action and the indicator.
That distinction matters because indicators are derived from market data rather than predictions of the future. They can improve your analysis, but they cannot remove uncertainty or guarantee a profitable trade.
The goal of this guide is therefore not to give you a collection of signals to follow blindly. Instead, we’ll look at 7 crypto trading indicators, what information each provides, where it can be useful, and how traders can combine them without turning a simple chart into a confusing mess.
7 Best Crypto Trading Indicators
Not every indicator deserves a permanent place on your trading chart. Some are better for identifying trends, while others are designed to measure momentum, volatility, or the strength of a price move. The key is choosing indicators that answer different questions instead of using several tools that produce almost the same information.
The following seven indicators are widely used in crypto technical analysis and can be useful across different trading styles. Their effectiveness, however, depends on the market condition and how they are combined with price action and risk management.
1. Relative Strength Index (RSI)
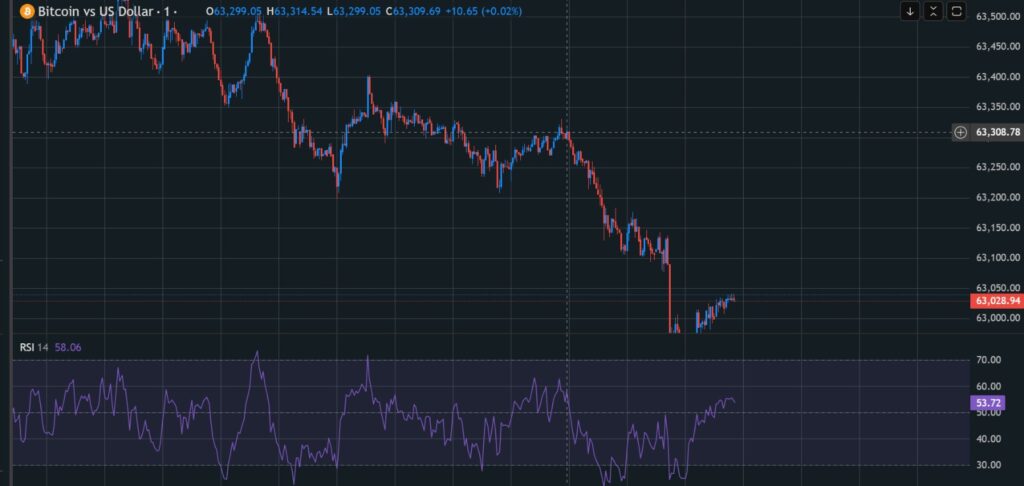
The Relative Strength Index, or RSI, is one of the first indicators I look at when I want to understand the momentum behind a crypto move. In my experience, RSI becomes much more useful when I stop treating the 70 and 30 levels as automatic buy or sell signals. A reading above 70 can remain elevated during a strong uptrend, while an RSI below 30 can stay oversold while the price continues falling.
What I find more valuable is watching how RSI behaves relative to price. For example, if the price makes a new high but RSI creates a lower high, I pay attention because it can show that bullish momentum is losing strength. I also watch the 50 level because it can provide a quick indication of whether momentum is generally leaning bullish or bearish.
This is where crypto trading indicators become more practical. I don’t use RSI alone to decide whether to enter a trade. I prefer to combine its reading with support and resistance, price structure, and volume. When several pieces of information point in the same direction, the RSI reading becomes much more meaningful.
For me, the biggest lesson from using RSI has been simple: the indicator itself is not the signal; the context around it is what matters.
2. Moving Average (MA)
Moving Average is one of the simplest tools I use when I want to remove some of the noise from a crypto chart and focus on the broader trend. Crypto prices can move sharply from one candle to the next, so reacting to every small movement can easily lead to poor decisions. A moving average smooths those fluctuations and gives a clearer picture of the direction price has been taking.
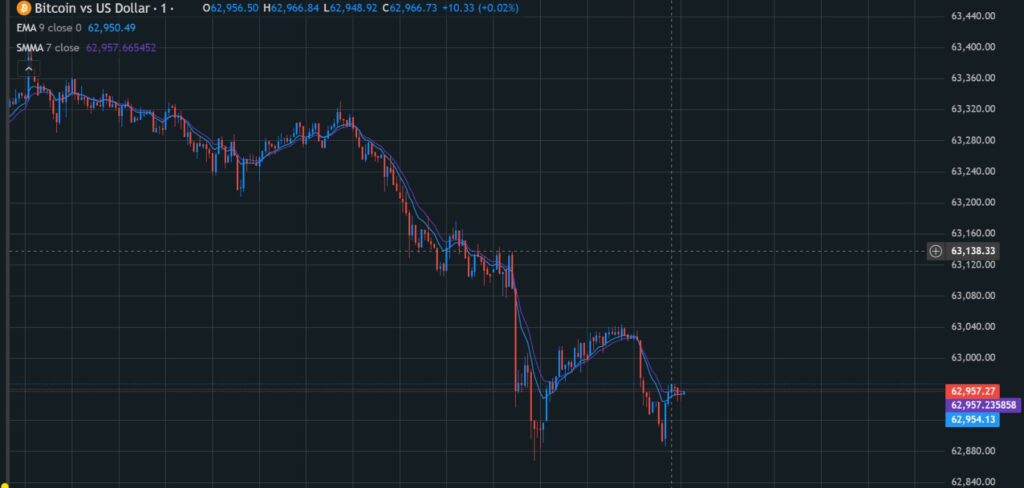
There are two types I find particularly useful: Simple Moving Average (SMA) and Exponential Moving Average (EMA). SMA gives equal importance to the selected periods, while EMA reacts more quickly to recent price changes. For faster-moving crypto markets, I often find EMA more responsive when assessing short-term momentum.
One thing I pay close attention to is how price behaves around a moving average. If price repeatedly stays above a rising MA, it can support the idea that buyers are controlling the trend. If price remains below a falling MA, sellers may have the stronger hand. However, I don’t treat every touch or crossover as an immediate trading signal.
In my experience, the biggest mistake is using moving averages without considering the market structure. During a sideways market, they can produce several misleading crossovers. This is why I prefer using moving averages alongside other crypto trading indicators, support and resistance, and price action.
For me, the real value of a moving average is not predicting the next candle. It is helping answer a much more practical question: Is the market actually trending, or am I simply reacting to short-term noise?
3. Moving Average Convergence Divergence (MACD)
MACD is one of the crypto trading indicators I find useful when I want to understand whether momentum is building or starting to fade. Unlike simply looking at price direction, MACD compares different moving averages to show changes in the strength of a trend.
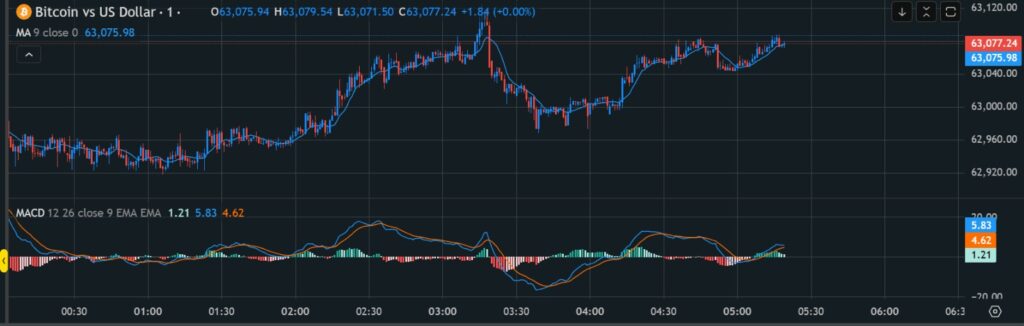
What makes MACD interesting is that it can sometimes give an early warning that a trend is losing momentum. I usually watch the MACD line, signal line, and histogram rather than focusing on a single crossover. When the MACD line moves above the signal line, it can suggest improving bullish momentum, while a move below the signal line may indicate weakening momentum.
The histogram adds another layer of information. When the bars become larger, momentum may be increasing. When they begin shrinking while price continues in the same direction, I pay closer attention because the move may be losing strength.
I also find MACD more valuable when it agrees with the overall market structure. For example, if price is approaching a major resistance level and MACD is showing weakening momentum, I would be more cautious about chasing the move.
One important point is that MACD is a lagging indicator, so it should not be expected to predict every market reversal. I use it mainly as a confirmation tool rather than allowing one crossover to determine an entire trade.
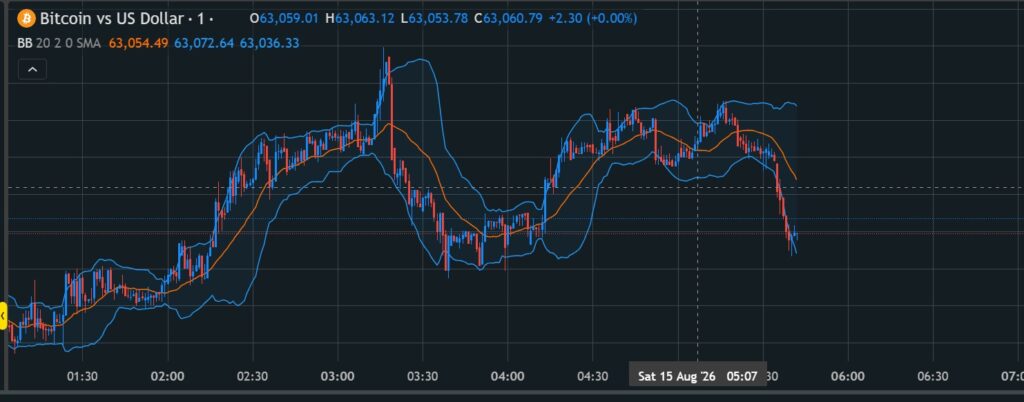
4. Bollinger Bands
Bollinger Bands are one of the crypto trading indicators I find particularly useful when the market starts behaving unusually. Instead of focusing only on whether price is rising or falling, Bollinger Bands help me understand how far price is moving from its recent average and whether volatility is expanding or contracting.
The indicator consists of three lines: a middle moving average and two outer bands that adjust according to market volatility. When the bands become wider, it usually means price movements are becoming more volatile. When they narrow, the market is becoming quieter, which can sometimes happen before a larger move.
One setup I pay attention to is a Bollinger Band squeeze. When the bands become unusually tight, I don’t immediately assume that price will move up or down. Instead, I watch for a breakout and then look for confirmation from volume and price structure.
I also avoid the common mistake of assuming that touching the upper band automatically means the market is overbought. In a strong bullish trend, price can continue riding the upper band for an extended period.
For my own analysis, Bollinger Bands work best when they are combined with other information. When volatility, price action, and momentum are telling a similar story, the indicator becomes much more useful than when it is used by itself.
5. Volume Indicator
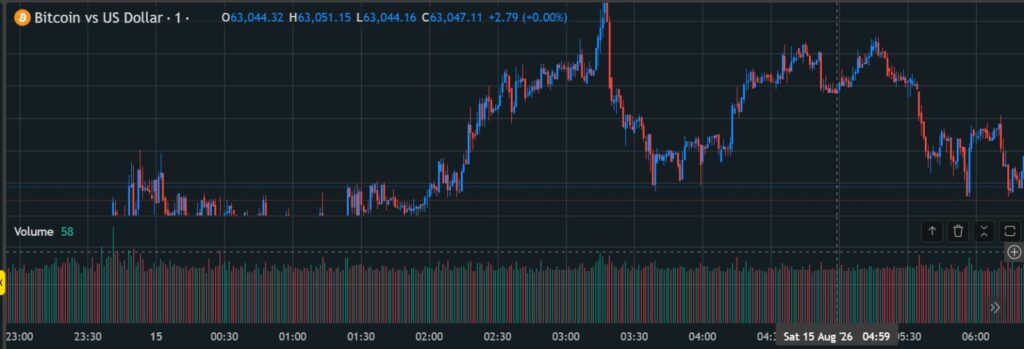
Volume is one of the most overlooked tools in crypto analysis, but it can add important context to a price movement. I use it to answer a simple question: Is there enough market participation behind this move?
For example, if Bitcoin breaks above a resistance level but the breakout happens on very low volume, I become cautious. The price may have moved higher, but the lack of participation can make the breakout less convincing. On the other hand, a breakout accompanied by a noticeable increase in volume can show that more traders are actively supporting the move.
Volume can also help identify changes in momentum. If price continues rising while volume gradually declines, it may suggest that buying interest is weakening. Similarly, a sharp increase in volume during a sell-off can indicate strong selling activity.
I don’t use volume as a standalone signal. Instead, I combine it with price structure and other crypto trading indicators to understand whether a move has real strength behind it.
For me, volume is valuable because it adds something that price alone cannot show: the level of participation behind the move. A strong-looking candle becomes much more interesting when the volume confirms it.
6. Stochastic Oscillator
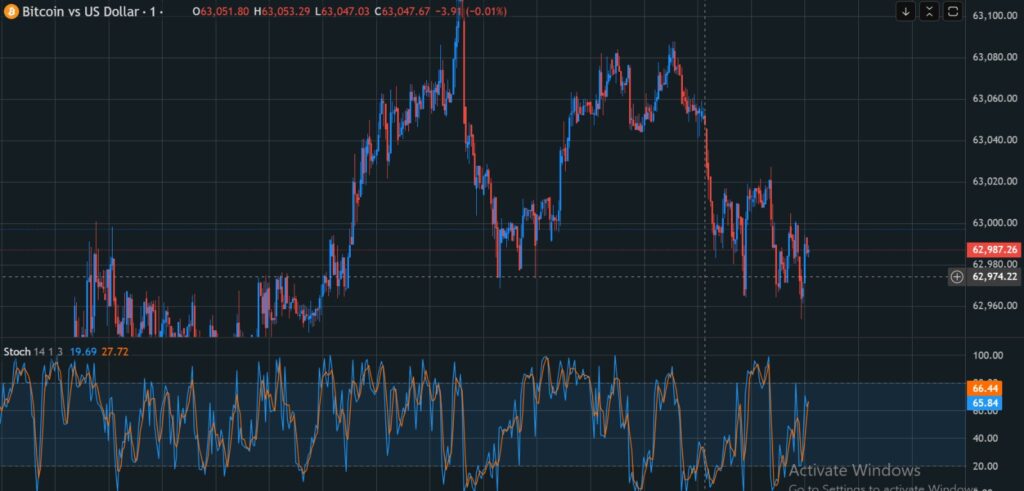
The Stochastic Oscillator is another useful momentum tool for understanding where the current price sits in relation to its recent trading range. I find it particularly helpful when a crypto market is moving sideways or when I want to examine whether short-term momentum is becoming stretched.
The indicator moves between 0 and 100. Traditionally, readings above 80 are considered overbought, while readings below 20 are considered oversold. However, I don’t treat these levels as automatic reversal signals. A strong crypto trend can remain above 80 or below 20 for much longer than expected.
What makes the Stochastic Oscillator more interesting is the relationship between its two lines. When the faster line crosses the slower line, it can provide an indication that short-term momentum is changing. I pay more attention when that crossover occurs near an important support or resistance area.
For example, if price reaches a major resistance level while the Stochastic begins turning downward from an elevated reading, it can provide additional evidence that momentum is weakening. The opposite can happen around strong support.
Among the different crypto trading indicators, I see the Stochastic Oscillator more as a timing and confirmation tool rather than something that should determine a trade by itself. The market structure still comes first.
7. Average True Range (ATR)
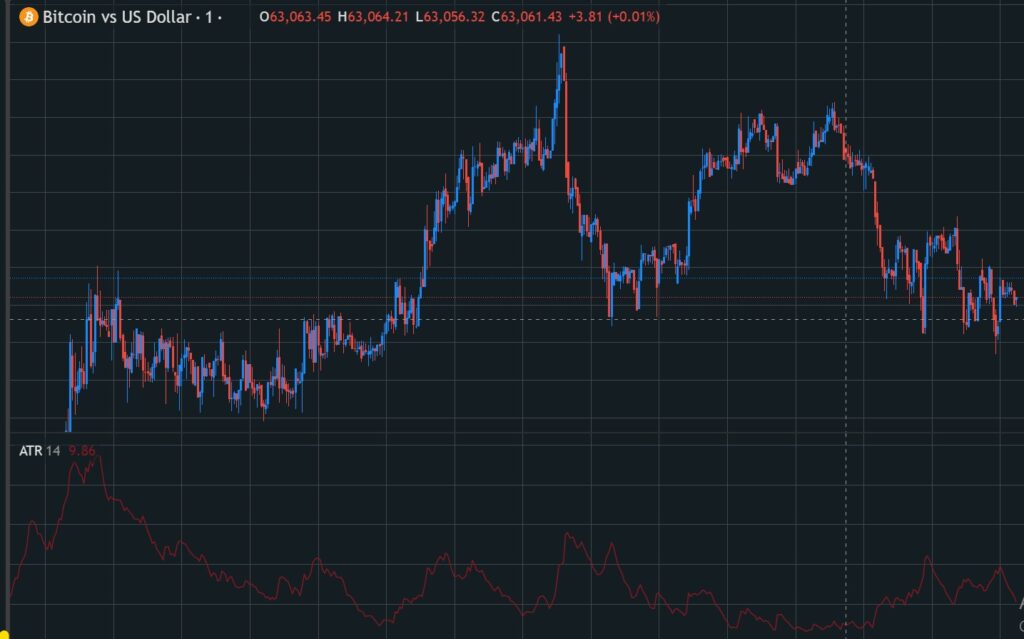
Average True Range, or ATR, is a little different from indicators that try to identify whether the market is bullish or bearish. Instead, it focuses on volatility. I find this useful in crypto because Bitcoin and altcoins can experience large price swings even when the overall trend has not changed.
ATR measures the average range of price movement over a selected period. A rising ATR generally means the market is becoming more volatile, while a falling ATR suggests that price movement is becoming quieter.
I use ATR mainly to understand how much room a trade may need. For example, placing a very tight stop-loss on a highly volatile coin can result in the position being closed by normal market fluctuations before the expected move develops. ATR can provide useful context when deciding whether a stop is unrealistically close to the current price.
Another interesting use is comparing volatility across different periods. If ATR suddenly increases after a long period of low volatility, I pay closer attention to the market because conditions may be changing.
Among the crypto trading indicators, ATR is valuable because it doesn’t try to tell me where price will go. Instead, it helps me understand how aggressively price is moving, which can improve position planning and risk management.
Conclusion
The seven indicators covered in this guide each provide a different view of the crypto market. RSI can help assess momentum, moving averages can make trends easier to identify, MACD can highlight changes in momentum, Bollinger Bands can provide insight into volatility, volume can reveal market participation, the Stochastic Oscillator can help with momentum timing, and ATR can help measure the intensity of price movement.
The important lesson is that crypto trading indicators are tools, not prediction machines. I have found that relying on a single indicator often creates a narrow view of the market. A better approach is to combine an indicator with price action, market structure, support and resistance, and sensible risk management.
You also don’t need a chart filled with indicators to make better decisions. In many situations, two or three tools that each serve a different purpose can provide more useful information than six indicators showing similar signals. The goal is not to find a perfect signal, but to build a consistent process for analyzing the market.
Frequently Asked Questions
What are the best crypto trading indicators for beginners?
RSI, moving averages, MACD, Bollinger Bands, and volume are good starting points because they cover different aspects of market analysis. Beginners should learn how each indicator works before combining several of them.
Which crypto trading indicator is the most accurate?
There is no single indicator that is always accurate. Market conditions change, and an indicator that works well during a strong trend may produce poor signals when the market moves sideways.
Can crypto trading indicators predict Bitcoin's price?
No. Indicators analyze existing market data and can help identify trends or momentum, but they cannot reliably predict the future price of Bitcoin.
Is RSI better than MACD for crypto trading?
Neither is universally better. RSI is useful for studying momentum and potential overbought or oversold conditions, while MACD is useful for examining trend momentum and changes in momentum. Their usefulness depends on the trading setup.