Introduction
Every successful trader knows that making consistent profits is not about luck—it is about having a clear plan. That plan is called a trading strategy. Whether you trade Forex, stocks, cryptocurrencies, commodities, or indices, a well-defined strategy helps you make informed decisions instead of relying on emotions or guesswork. Without a structured approach, traders often enter and exit the market randomly, leading to unnecessary losses.
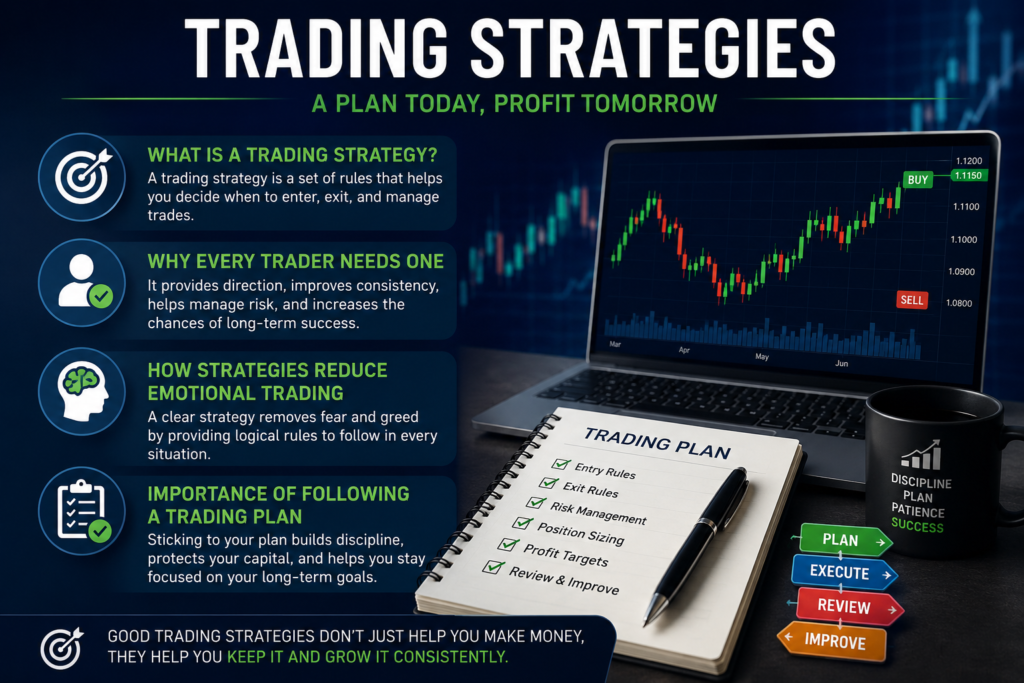
What Is a Trading Strategy?
A trading strategy is a set of predefined rules that guides every trading decision. It tells you when to enter a trade, where to place your stop-loss, when to take profits, and how much risk to accept. The best trading strategies are based on technical analysis, fundamental analysis, or a combination of both. Instead of making impulsive decisions, traders follow these rules consistently to improve their long-term performance.
Why Every Trader Needs One
Many beginners believe they can make money simply by predicting market direction, but successful trading requires discipline and consistency. Using reliable trading strategies helps traders avoid random decisions and stay focused on their goals. A good strategy also makes it easier to evaluate performance because every trade follows the same set of rules. Over time, this consistency allows traders to identify what works and what needs improvement.
How Strategies Reduce Emotional Trading
Fear and greed are two of the biggest reasons traders lose money. Fear may cause you to close profitable trades too early, while greed can tempt you to hold losing positions for too long. Well-designed trading strategies remove much of this emotional decision-making by providing clear entry, exit, and risk management rules. When you trust your strategy, you are less likely to make impulsive trades based on short-term market movements or emotions.
The Importance of Following a Trading Plan
Having a strategy is only half the battle—the real success comes from following it consistently. Even the most profitable trading strategies will experience losing trades because no strategy wins 100% of the time. However, disciplined traders understand that long-term profitability comes from sticking to their plan rather than chasing every market opportunity. A solid trading plan includes risk management, position sizing, profit targets, and regular performance reviews. By following proven trading strategies with patience and discipline, traders can build confidence, improve consistency, and increase their chances of long-term success in the financial markets.
What Is a Trading Strategy?
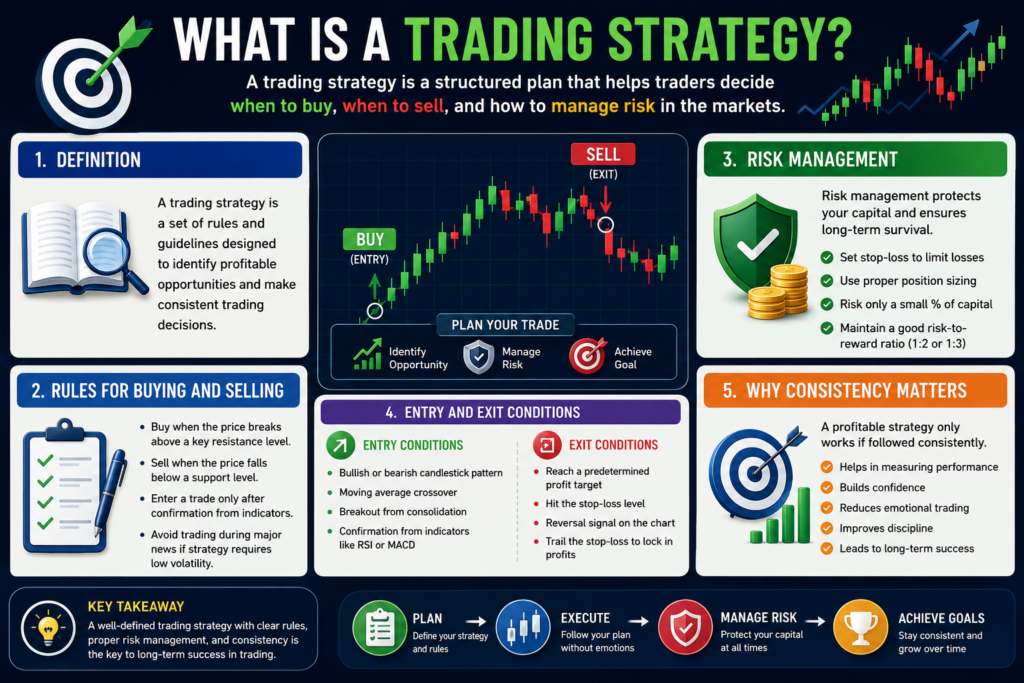
A trading strategy is a structured plan that helps traders decide when to buy, when to sell, and how to manage risk in the financial markets. Instead of relying on emotions or random guesses, a trading strategy uses predefined rules to make objective trading decisions. Whether you trade Forex, stocks, cryptocurrencies, gold, or indices, having a well-defined strategy can improve consistency and reduce costly mistakes.
Definition of a Trading Strategy
A trading strategy is a set of rules and guidelines designed to identify profitable trading opportunities. These rules are based on technical analysis, fundamental analysis, price action, or a combination of different methods. The goal is to create a repeatable process that allows traders to make disciplined decisions regardless of changing market conditions.
Every successful trader follows a strategy that has been tested and refined over time. Rather than reacting emotionally to every price movement, traders rely on their strategy to guide their actions.
Rules for Buying and Selling
One of the most important parts of a trading strategy is establishing clear rules for entering and exiting trades. These rules remove uncertainty and help traders avoid impulsive decisions.
For example, a strategy may include:
- Buy when the price breaks above a key resistance level.
- Sell when the price falls below a support level.
- Enter a trade only after receiving confirmation from technical indicators.
Risk Management
Risk management is the foundation of every successful trading strategy. Even the best traders experience losing trades, which is why protecting trading capital is essential.
A strong risk management plan typically includes:
- Setting a stop-loss to limit potential losses.
- Using proper position sizing based on account balance.
- Risking only a small percentage of capital on each trade.
- Maintaining a favorable risk-to-reward ratio, such as 1:2 or 1:3.
4. Types of Trading Strategies
- Trend Trading
- Swing Trading
- Day Trading
- Scalping
- Position Trading
- News Trading
- Breakout Trading
- Reversal Trading
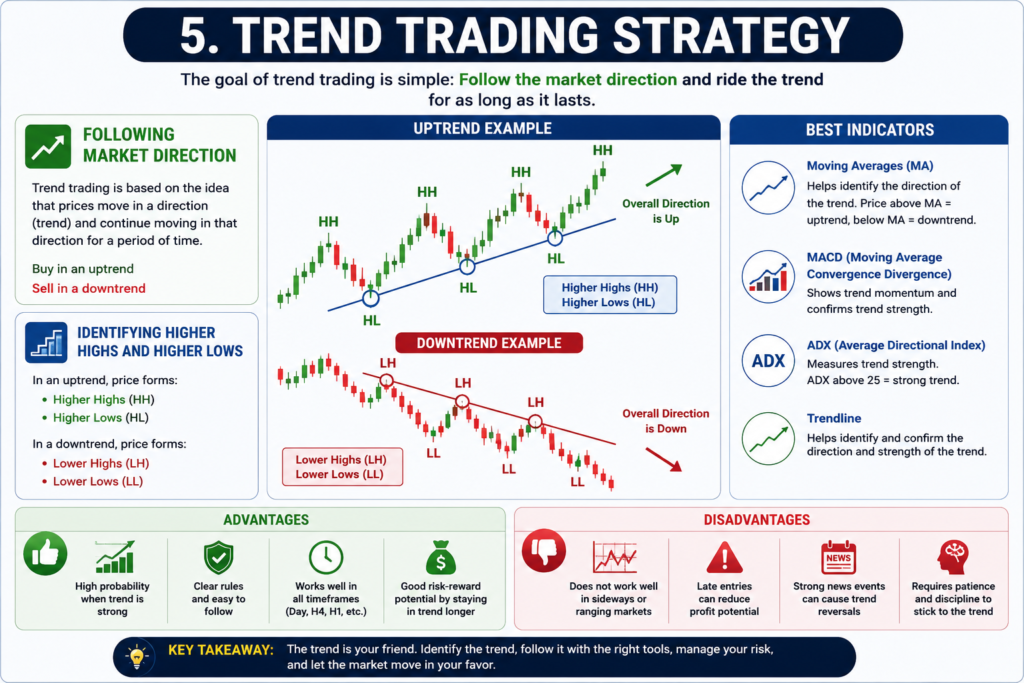
5. Trend Trading Strategy
A trend trading strategy is one of the most popular and effective approaches used by traders in the financial markets. The main idea is simple: identify the market’s direction and trade in the same direction as the trend. Instead of trying to predict market reversals, trend traders aim to profit from sustained price movements by entering trades after a trend has been established.
The famous trading saying, “The trend is your friend,” perfectly describes this strategy. When markets are making higher prices over time, traders look for buying opportunities. When prices continue moving lower, traders focus on selling opportunities.
Following Market Direction
The first step in a trend trading strategy is determining the overall market direction. Markets generally move in three ways:
- Uptrend: Prices continue moving higher.
- Downtrend: Prices continue moving lower.
- Sideways Market: Prices move within a range without a clear direction.
Trend traders avoid fighting the market. Instead, they wait for confirmation that a trend exists before entering a position.
Best Indicators for Trend Trading
Although price action alone can identify trends, many traders use technical indicators for confirmation.
1. Moving Averages (MA)
Moving averages smooth price data and help traders identify the market’s direction.
- Price above the 200 EMA → Uptrend
- Price below the 200 EMA → Downtrend
Popular moving averages include:
- 20 EMA
- 50 EMA
- 100 EMA
2. MACD (Moving Average Convergence Divergence)
The MACD measures momentum and trend strength.
Traders use it to:
- Confirm trend direction
- Spot momentum shifts
- Identify bullish and bearish crossovers
3. ADX (Average Directional Index)
The ADX measures how strong a trend is.
General interpretation:
- Below 20 → Weak trend
- 20–25 → Trend developing
- Above 25 → Strong trend
- Above 40 → Very strong trend
4. Trendlines
Drawing trendlines connects higher lows during an uptrend or lower highs during a downtrend.
Trendlines help traders:
- Confirm trend direction
- Find support and resistance
- Identify breakout opportunities
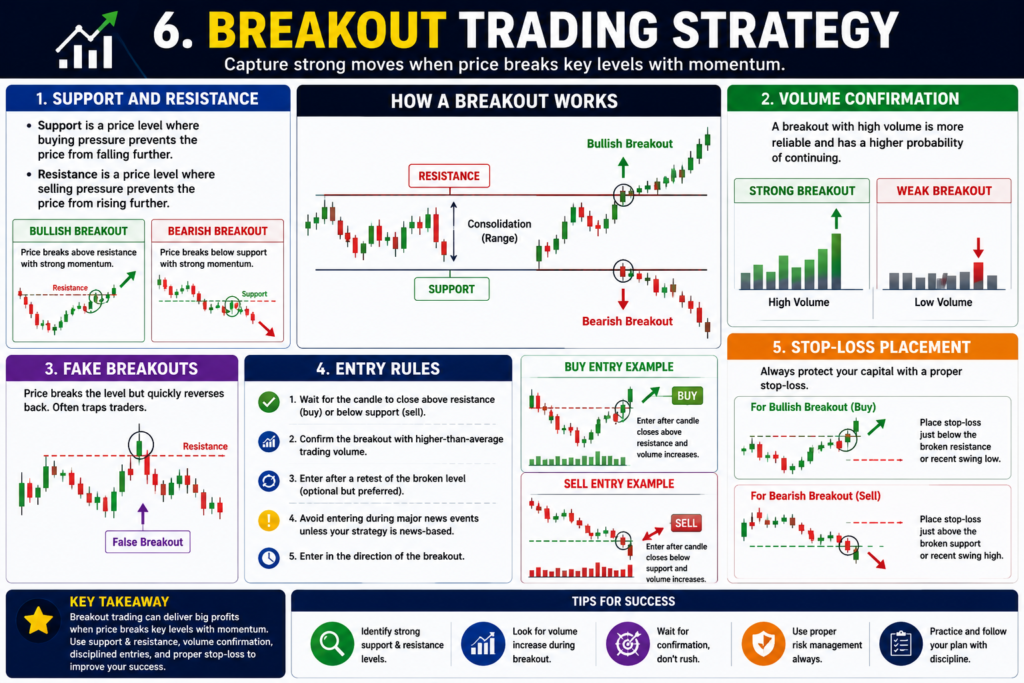
6. Breakout Trading Strategy
A breakout trading strategy is one of the most widely used trading strategies because it allows traders to capture strong price movements when the market breaks out of a key price level. A breakout occurs when the price moves above a resistance level or below a support level with increased momentum. These moves often signal the beginning of a new trend, providing traders with excellent profit opportunities.
Unlike range trading, where traders expect prices to remain between support and resistance, breakout traders anticipate a significant move after the price escapes this range. However, successful breakout trading requires patience, proper confirmation, and effective risk management.
Understanding Support and Resistance
Support and resistance are the foundation of breakout trading strategies.
- Support is a price level where buying pressure is strong enough to prevent the price from falling further.
- Resistance is a price level where selling pressure prevents the price from moving higher.
When the price repeatedly tests these levels, they become stronger. Eventually, if buyers or sellers gain enough momentum, the market breaks through one of these levels, creating a breakout.
Bullish Breakout
A bullish breakout occurs when the price closes above a strong resistance level. This indicates that buyers have taken control and the market may continue moving upward.
Bearish Breakout
A bearish breakout happens when the price falls below a major support level. This suggests that sellers are in control and that further downside movement is likely.
Volume Confirmation
Volume plays a crucial role in successful trading strategies, especially breakout trading. A breakout accompanied by high trading volume is generally more reliable than one with low volume.
High volume indicates that many traders are participating in the move, increasing the likelihood that the breakout will continue. On the other hand, low-volume breakouts often lack momentum and are more likely to fail.
When analyzing a breakout, traders should look for:
- Increased trading volume during the breakout.
- A strong candlestick closing beyond support or resistance.
Fake Breakouts
Not every breakout leads to a new trend. Sometimes the price briefly moves above resistance or below support before quickly reversing back into the trading range. This is known as a fake breakout or false breakout.
Fake breakouts often occur because:
- Large institutional traders trigger stop-loss orders.
- There is insufficient buying or selling pressure.
- Important economic news causes temporary volatility.
- Traders enter the market too early without confirmation.
Entry Rules
Having clear entry rules is essential for consistent trading strategies. Rather than entering immediately when the price touches a support or resistance level, traders wait for confirmation.
Common entry rules include:
- Wait for the candle to close above resistance for a bullish breakout.
- Wait for the candle to close below support for a bearish breakout.
- Confirm the breakout with higher-than-average trading volume.
- Enter after the price successfully retests the breakout level and continues in the breakout direction.
- Avoid entering trades during major news events unless your strategy is designed for high volatility.
7. Price Action Trading Strategy
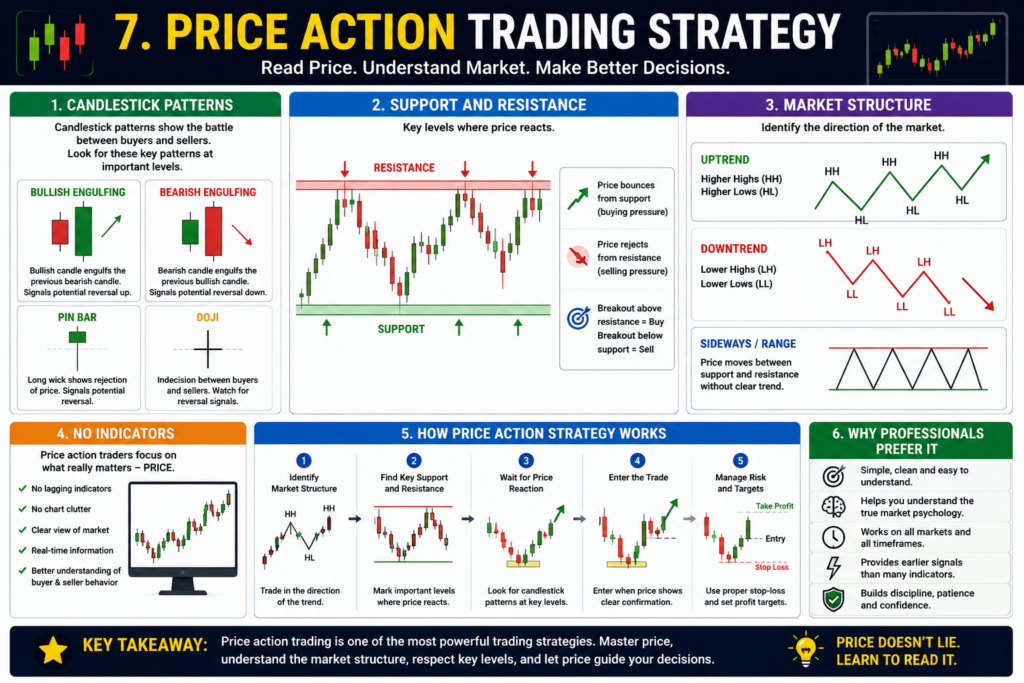
A Price Action Trading Strategy is one of the most effective trading strategies used by professional traders around the world. Instead of relying on multiple technical indicators, this strategy focuses solely on price movements shown on the chart. By studying candlestick patterns, market structure, and key support and resistance levels, traders can understand market sentiment and make informed trading decisions.
Many experienced traders believe that price contains all the information needed to analyze the market. Since indicators are calculated from historical price data, price action traders prefer to read the market directly rather than relying on lagging signals.
Candlestick Patterns
Candlestick patterns are the foundation of price action trading strategies. Every candlestick tells a story about the battle between buyers and sellers during a specific period.
Some of the most popular candlestick patterns include:
Bullish Engulfing
A Bullish Engulfing pattern forms when a large bullish candle completely covers the previous bearish candle. It signals that buyers have taken control and the market may move higher.
Bearish Engulfing
A Bearish Engulfing pattern occurs when a large bearish candle completely engulfs the previous bullish candle. This suggests that sellers are gaining strength and the market could decline.
Pin Bar
A Pin Bar has a long wick and a small body. It shows that the market rejected a certain price level and often signals a potential reversal.
Doji
A Doji candle has a very small body, indicating indecision between buyers and sellers. When it appears near important support or resistance levels, it can signal a possible trend reversal.
Support and Resistance
Support and resistance are essential components of trading strategies, especially in price action trading.
- Support is a price level where buying pressure tends to stop prices from falling further.
- Resistance is a price level where selling pressure prevents prices from moving higher.
Price action traders closely monitor these zones because they often become areas where the market reverses, consolidates, or breaks out.
For example:
- A Bullish Engulfing candle at support may provide a strong buying opportunity.
- A Bearish Engulfing candle at resistance may indicate a potential selling opportunity.
Market Structure
Market structure helps traders identify the overall direction of the market. Understanding market structure is one of the most important aspects of successful trading strategies.
Uptrend
An uptrend forms when the market creates:
- Higher Highs (HH)
- Higher Lows (HL)
This indicates buyers are in control.
Downtrend
A downtrend forms when the market creates:
- Lower Highs (LH)
- Lower Lows (LL)
This shows that sellers dominate the market.
Sideways Market
When the market fails to create higher highs or lower lows, it moves within a range. During these periods, traders usually wait for a breakout before entering new positions.
Reading market structure allows traders to trade in the direction of the prevailing trend rather than against it.
No Indicators
One of the biggest advantages of a Price Action Trading Strategy is that it requires little to no technical indicators.
Instead of relying on tools such as:
- Moving Averages
- RSI
- MACD
- Stochastic Oscillator
Price action traders focus on:
- Price movement
- Candlestick formations
- Trendlines
- Support and resistance
- Market structure
Since indicators are based on past price data, they often generate delayed signals. Price action provides real-time information, allowing traders to react more quickly to changing market conditions.
Simple charts also reduce clutter, making it easier to identify high-quality trading opportunities.
Why Professionals Prefer Price Action
Many institutional traders, hedge fund managers, and experienced market participants prefer price action because it offers a clear and objective view of market behavior.
Professionals choose price action because it:
- Eliminates unnecessary chart clutter.
- Helps identify high-probability trade setups.
- Works across Forex, stocks, gold, cryptocurrencies, commodities, and indices.
- Can be used on any timeframe, from one-minute charts to monthly charts.
- Improves understanding of buyer and seller psychology.
- Provides earlier signals than many lagging indicators.
8. Swing Trading Strategy
A Swing Trading Strategy is one of the most popular trading strategies for traders who want to take advantage of medium-term price movements without constantly monitoring the markets. Instead of opening and closing trades within the same day, swing traders typically hold positions for several days or even a few weeks, aiming to capture significant market swings.
This approach is ideal for people who cannot watch charts all day but still want to benefit from meaningful price movements. Swing trading combines technical analysis, market trends, and proper risk management to identify high-probability trading opportunities.
Holding Trades for Several Days
The defining feature of a swing trading strategy is holding trades for longer than day trading but shorter than long-term investing.
Most swing trades remain open for:
- 2–5 days
- 1–2 weeks
- Occasionally up to a month, depending on market conditions
The goal is to capture a large portion of a market move rather than small intraday fluctuations. Swing traders look for established trends, pullbacks, breakouts, or reversal patterns before entering a trade.
Best Timeframes
Choosing the correct timeframe is an important part of successful trading strategies, especially for swing trading.
The most commonly used timeframes include:
4-Hour (H4) Chart
The 4-hour chart provides detailed price action while filtering out much of the market noise. Many swing traders use this timeframe to identify trade setups and entry points.
Daily (D1) Chart
The daily chart is the most popular timeframe for swing traders. It clearly shows market trends, support and resistance levels, and major candlestick patterns.
Weekly (W1) Chart
Some swing traders use the weekly chart to identify the overall market trend before making decisions on the daily or 4-hour charts.
A common approach is multi-timeframe analysis:
- Weekly chart → Identify the long-term trend.
- Daily chart → Find trading opportunities.
- 4-hour chart → Fine-tune entries and exits.
This method helps traders align their trades with the broader market direction.
Risk-to-Reward Ratio
Risk management is one of the most important aspects of all trading strategies, and swing trading is no exception.
The Risk-to-Reward Ratio (R:R) compares the amount of money you are willing to risk with the potential profit you expect to earn.
For example:
- Risk $100 to make $200 = 1:2 Risk-to-Reward
- Risk $100 to make $300 = 1:3 Risk-to-Reward
9. Scalping Strategy
A Scalping Strategy is one of the fastest-paced trading strategies used in the financial markets. Instead of holding positions for hours or days, scalpers aim to make numerous small profits by entering and exiting trades within seconds or a few minutes. The idea is that many small gains can add up to significant profits over time.
Scalping requires quick decision-making, strict discipline, and excellent risk management. Since market movements on low timeframes are often small, traders rely on speed and precision to take advantage of short-term price
fluctuations.
Small Profits
The primary goal of a scalping strategy is to capture small price movements repeatedly throughout the trading session. Unlike swing traders who target large price moves, scalpers focus on making consistent gains from multiple trades.
For example, a scalper may aim to earn:
- 5–10 pips in the Forex market.
- A small percentage move in stocks or cryptocurrencies.
- Several quick points in gold or index trading.
While each trade may generate only a modest profit, completing many successful trades during the day can produce substantial overall returns.
Fast Execution
Speed is one of the most important factors in successful trading strategies for scalping. Markets can move rapidly, and even a few seconds of delay may affect trade results.
Scalpers typically:
- Execute trades immediately after receiving a signal.
- Use one-click trading platforms for faster order placement.
- Monitor price movements continuously during active trading hours.
- Exit losing trades quickly to prevent small losses from becoming large ones.
Low Timeframes
Scalping is performed on very short-term charts because they provide more trading opportunities throughout the day.
The most commonly used timeframes include:
1-Minute (M1)
The 1-minute chart is the most popular choice for scalpers. It offers frequent price movements and allows traders to enter multiple trades during a session.
5-Minute (M5)
Many beginners prefer the 5-minute timeframe because it produces fewer false signals while still providing numerous trading opportunities.
15-Minute (M15)
Some traders use the 15-minute chart to identify the short-term trend while executing entries on the 1-minute or 5-minute chart.
Using multiple timeframes can improve trade accuracy by aligning short-term entries with the overall market direction.
10. Moving Average Strategy
A Moving Average Strategy is one of the simplest and most effective methods used by traders to identify market trends and potential trading opportunities. Moving averages smooth out price fluctuations, making it easier to recognize the overall direction of the market. They are widely used in Forex, stocks, cryptocurrencies, commodities, and indices.
The two most common types of moving averages are the Exponential Moving Average (EMA) and the Simple Moving Average (SMA). Traders often combine two moving averages with different periods to generate buy and sell signals.
EMA Crossover Strategy
The Exponential Moving Average (EMA) gives more weight to recent price movements, making it more responsive to current market conditions than the SMA. Because of its faster reaction, the EMA is popular among day traders and swing traders.
A common EMA crossover setup uses:
- 20 EMA (Fast EMA)
- 50 EMA (Slow EMA)
Buy Signal
A bullish signal occurs when the 20 EMA crosses above the 50 EMA. This crossover indicates that buying momentum is increasing and the market may continue moving upward.
Sell Signal
A bearish signal occurs when the 20 EMA crosses below the 50 EMA. This suggests that selling pressure is strengthening and the market may continue declining.
Many traders wait for the candle to close after the crossover before entering a trade to avoid false signals.
SMA Crossover Strategy
The Simple Moving Average (SMA) calculates the average closing price over a specific period, giving equal weight to all price data. It reacts more slowly than the EMA, making it useful for identifying long-term trends.
A popular SMA crossover strategy uses:
- 50 SMA
- 200 SMA
Uptrend Confirmation
An uptrend is confirmed when:
- Price remains above the moving average.
- The moving average is sloping upward.
- The faster moving average stays above the slower moving average.
This indicates that buyers are in control of the market.
Downtrend Confirmation
A downtrend is confirmed when:
- Price remains below the moving average.
- The moving average slopes downward.
- The faster moving average stays below the slower moving average.
This suggests that sellers have taken control.
By trading in the direction of the confirmed trend, traders can improve the probability of successful trades.
11. RSI Strategy
The Relative Strength Index (RSI) is one of the most popular momentum indicators used in technical analysis. Developed by J. Welles Wilder Jr., the RSI measures the speed and strength of price movements on a scale from 0 to 100. Traders use it to identify overbought and oversold market conditions, detect potential trend reversals, and confirm trading opportunities.
Although the RSI is a powerful tool, it works best when combined with price action, support and resistance levels, and proper risk management rather than being used on its own.
Overbought Conditions
An asset is considered overbought when the RSI rises above 70. This suggests that buying pressure has been very strong and the market may be due for a pullback or reversal.
However, an RSI reading above 70 does not automatically mean traders should sell immediately. In strong uptrends, the RSI can remain above 70 for an extended period while prices continue rising.
Instead, traders should wait for additional confirmation before opening a sell position.
Common signs of an overbought market include:
- RSI above 70.
- Price reaching a major resistance level.
- Bearish candlestick patterns are forming.
- Weakening buying momentum.
When several of these signals appear together, the probability of a reversal increases.
Oversold Conditions
An asset is considered oversold when the RSI falls below 30. This indicates that selling pressure has been unusually strong and the market may be ready for a bounce.
Like overbought conditions, an RSI below 30 does not guarantee an immediate reversal. During strong downtrends, the RSI may remain below 30 for several trading sessions.
Experienced traders wait for confirmation before entering a buy trade.
RSI Divergence
One of the most powerful features of the RSI is its ability to identify divergence, which occurs when the RSI and price move in opposite directions.
Bullish Divergence
Bullish divergence happens when:
- Price forms a lower low.
- RSI forms a higher low.
This suggests that selling momentum is weakening even though the price continues to decline. A bullish divergence often appears before an upward reversal.
Bearish Divergence
Bearish divergence occurs when:
- Price forms a higher high.
- RSI forms a lower high.
This indicates that buying momentum is weakening despite rising prices and may signal an upcoming downward reversal.
Although divergence can provide early warning signals, traders should always wait for confirmation before entering a trade.
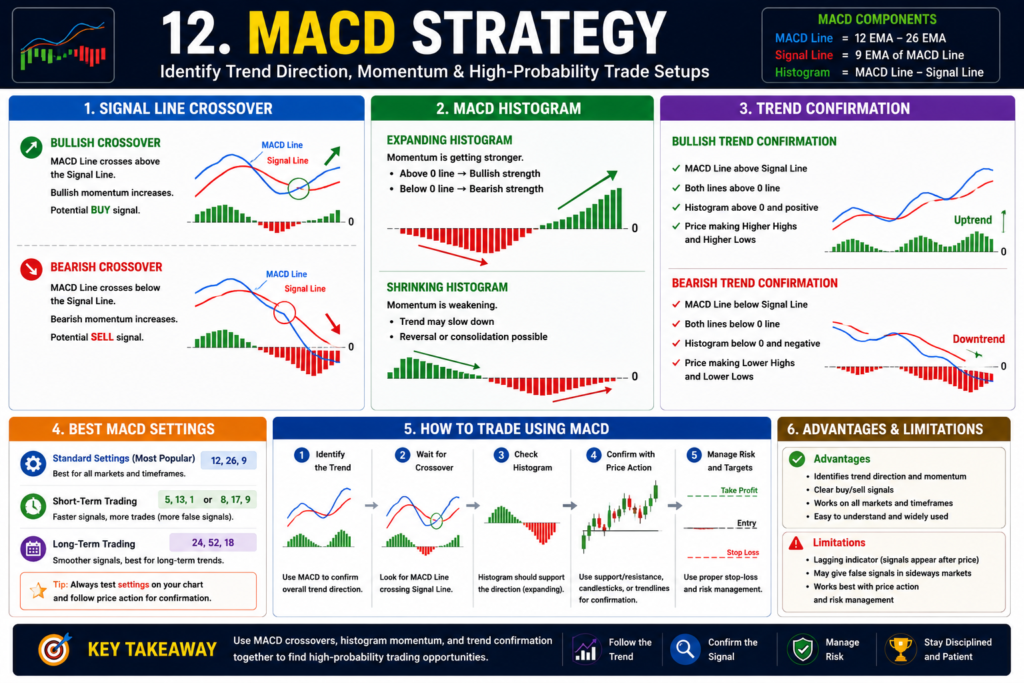
12. MACD Strategy
The Moving Average Convergence Divergence (MACD) is one of the most reliable momentum and trend-following indicators used by traders worldwide. It helps identify the strength and direction of a trend while providing potential buy and sell signals through crossovers and momentum analysis.
The MACD consists of three main components:
- MACD Line
- Signal Line
- Histogram
Unlike many other indicators, the MACD can help traders identify both trend direction and momentum, making it a valuable tool for Forex, stocks, cryptocurrencies, gold, and indices.
Signal Line Crossover
The most common trading signal generated by the MACD is the Signal Line Crossover.
The Signal Line is a 9-period Exponential Moving Average (EMA) of the MACD line. When the MACD line crosses the Signal Line, it creates potential trading opportunities.
Bullish Crossover
A bullish crossover occurs when:
- The MACD Line crosses above the Signal Line.
This indicates that bullish momentum is increasing and buyers may be taking control of the market.
Many traders consider this a potential buy signal, especially when it occurs during an uptrend or near a key support level.
Bearish Crossover
A bearish crossover occurs when:
- The MACD Line crosses below the Signal Line.
This suggests that bearish momentum is strengthening and sellers may be gaining control.
It is commonly used as a sell signal, particularly when confirmed by resistance or bearish price action.
For greater accuracy, traders often wait for the candle to close before acting on a crossover signal.
MACD Histogram
The Histogram measures the distance between the MACD Line and the Signal Line. It helps traders visualize changes in market momentum.
Expanding Histogram
When the histogram bars become larger:
- Bullish momentum is strengthening if the bars are above the zero line.
- Bearish momentum is increasing if the bars are below the zero line.
An expanding histogram often indicates that the current trend is gaining strength.
Shrinking Histogram
When the histogram bars begin to shrink:
- Momentum is weakening.
- The current trend may be losing strength.
- A reversal or consolidation could be approaching.
The histogram is especially useful because it often provides an early warning before a MACD crossover occurs.
Trend Confirmation
One of the biggest advantages of the MACD is its ability to confirm the direction of the overall trend.
Bullish Trend Confirmation
A bullish trend is confirmed when:
- The MACD Line remains above the Signal Line.
- Both lines are above the zero line.
- The histogram stays positive.
This indicates strong buying momentum and supports looking for buying opportunities.
Bearish Trend Confirmation
A bearish trend is confirmed when:
- The MACD Line remains below the Signal Line.
- Both lines stay below the zero line.
- The histogram remains negative.
This suggests that sellers are in control and selling opportunities may be more favorable.
Using the MACD to confirm the trend helps traders avoid taking trades against the prevailing market direction.